Figure 1
The most recent annual survey of departments, covering the 2000–01 academic year, provides a rosy picture of the hiring patterns as they were before the recent economic disruptions. For the second year, there was a slight increase in the number of full-time tenure-track faculty, the decades-long increases in part-time and adjunct faculty came to an end, and the proportion of tenured faculty increased for the first time in at least two decades.1
The relative balance between full-time and part-time faculty was essentially unchanged from the prior year’s survey, as the proportion of history faculty employed part time held steady at just over 26 percent for the third year in a row. Despite a relatively placid surface, the underlying changes taking place in the departments are really quite remarkable. The survey showed that in 2000–01 5 percent of the full-time faculty positions in the departments fell vacant for a variety of reasons, and most were filled by new full-time tenure-track faculty.
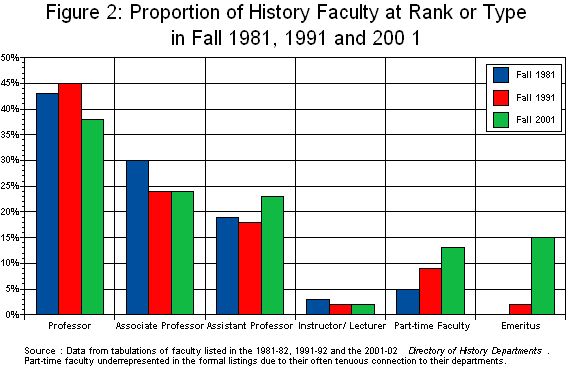
This turnover rate has risen steadily since the 1995–96 academic year, as one out of four faculty at the average history department were replaced over a five-year span. The difference is reflected in tabulations of faculty in the Directory of History Departments, which indicates the sharp increase in the proportion of emeritus faculty between 1991 and 2001, and the slightly smaller increase in the number of assistant professors on the faculty and decline in full professors (Figure 2).

Figure 2
It is important to note that not all of those leaving the departments were retiring from teaching. Only half of the departing faculty retired from teaching. Just over a third of the faculty left their departments to take up employment somewhere else, as one of the ripple effects of the recent retirements resulted in mid-level faculty being hired away by more prestigious universities. Since many of these faculty were hired to tenured posts, and departments gave tenure to junior faculty hired when the wave of retirements began in the late 1990s, the 2000–01 academic year marked the first increase in the proportion of tenured faculty in at least five years. Of those eligible for tenure, 77.8 percent were tenured—a slight increase from 75.9 percent the year before. When part-time and adjunct faculty are included in the calculations, this appears to be the first increase in the proportion of history faculty with tenure in more than two decades.
Perhaps the best news in the survey was that the net number of full-time tenure-track faculty actually grew when compared to that in the previous year, as departments hired additional faculty to replace faculty who had retired a year or two earlier, or added new faculty to deal with increasing enrollments in history classes (see related story on page 7). Obviously a snapshot for this year is likely to be different, given the economic dislocations since the fall of 2001, but the data does indicate that history can still hold its own under normal circumstances.
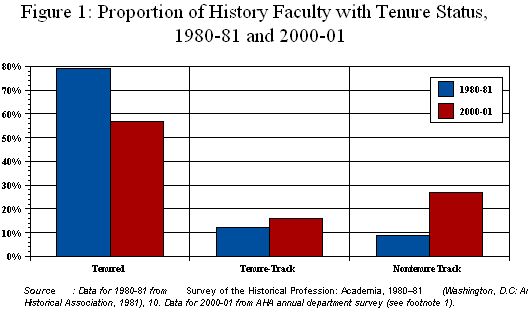
Despite the recent trend, it is important to note how different the composition of today’s history department is in comparison to that prevailing just 20 years ago. In a survey of departments conducted in 1980–81, the AHA found that nontenure-track faculty accounted for just over 6 percent of the faculty in history departments.2 At the same time faculty in tenured or tenure-track positions fell from 91.4 percent of the responding departments in 1980–81 to 73.0 percent in 2000–01 (Figure 1). The change reflects the sharp increase in the number of part-time faculty, as the proportion of full-time faculty with tenure or on the tenure track has changed very little over that span of time. Tenure-track faculty currently comprise 92.7 percent of the full-time faculty in the departments, little changed from a proportion of just over 94 percent 20 years ago. Only 2 percent of the vastly expanded ranks of part-time faculty hold positions with tenure or are on the tenure track.
Comparisons across the years on the full range of instructional staff are necessarily incomplete because the earlier surveys failed to ask about the number of graduate teaching assistants. However, when they are included in the mix of instructional staff in the 2000–01 survey, TAs comprise 16 percent of those with some classroom responsibilities in history departments—and one out of every four in PhD-granting history programs.
Faculty in the Classroom
The average course load for full-time history faculty was just over 5 classes per year, compared to an average of 2.5 courses for part-time faculty. Baccalaureate institutions, which emphasize teaching over research, had the highest average course load for full-time faculty at 5.8 classes per faculty member. In contrast, full-time faculty at research institutions (classified by the Carnegie Foundation as “Doctoral” or “Research Universities”) taught an average of 3.9 classes per year.
The survey also asked about the geographic field specializations of full- and part-time faculty. The largest proportion of faculty (38.6 percent) was employed to teach U.S. history, followed at some distance by European history, which accounted for another 27.3 percent of the course faculty. The remaining fields all accounted for less than 10 percent of the faculty, led by Asian history (comprising 7.3 percent of faculty), followed by Latin America (5.7 percent), world history (5.6 percent), Western civilization (5.4 percent), Africa (3.4 percent), other thematic courses (4.0 percent), and the Middle East (2.6 percent).
However, there are significant differences in the proportions of full- and part-time faculty, as part-time faculty were more likely to be found among those hired to teach U.S. history or the world and Western civ courses. In comparison, almost two-thirds of the faculty teaching European, Asian, and Latin American history were employed full time.
A large number of programs lack faculty specializing in major regions of the world outside North America. More than 27 percent of the departments lack a specialist in Asian history, while 30 percent of the programs lack a specialist in Latin America, 47 percent don’t have an Africanist, and 58 percent of the programs don’t have anyone specializing in the Middle East. These were all unchanged from the year before. Departments without a specialist in a particular field will often rely on faculty with other primary specializations to provide some coverage. Even so, 21 percent of the programs did not offer a course in Asian history, 31 percent offered no courses in Latin American history, 40 percent had nothing in African history, and 50 percent had nothing on the history of the Middle East.
Notes
- The survey asked for information about the 2000–01 academic year, and received an exceptional response rate—349 of 654 U.S. departments that have listed in the Directory in one of the past two years responded. While respondents to the survey formed a representative sample of departments in the Directory (variance of <0.026 between the two data sets when compared by degree, region, and control), the Directory itself is not a representative sample of the many different types of history departments and history faculties in higher education. Two-year colleges and programs where the history faculty is integrated into a multidisciplinary department (such as history, politics, and geography) are significantly underrepresented because they do not usually seek listings in the directory. The Directory includes only three AA-granting programs, even though the U.S. Department of Education reports 227 programs that confer AA degrees in the social sciences and history. Similarly, the Directory includes less than half of the reported number of programs conferring BA degrees in social sciences and history (though these programs produce almost 90 percent of the history bachelor’s degrees in the country, when compared to Department of Education data). The responding departments reported employing 8,258 faculty—a bit less than half of the history faculty teaching in the United States, which we currently estimate at just under 17,500 at two- and four-year colleges and universities. [↩]
- Survey of the Historical Profession: Academia, 1980–81 (Washington, D.C.: American Historical Association, 1981). The earlier surveys made a better effort to be comprehensive, sending out a mailing to over 1,150 departments and receiving responses from around 420 departments each time. The respondents to these earlier surveys had a significantly higher proportion of private institutions (54 percent in the 1980 survey compared to 48 percent in the present study) and departments that conferred the BA as the highest degree (which comprised 56 percent of the 1980 respondents and only 47 percent today). Programs conferring associates degrees were absent from the earlier study, and comprised only three respondents in the present study. [↩]

