Recent surveys of PhD production in history and academic job openings for historians suggest that employment prospects for history PhDs have improved somewhat in the past year. However, a gap between new PhDs and new job listings in Perspectives persists. Furthermore, the total number of graduate students enrolled in PhD programs remains near the highest level since the mid-1980s, and the National Research Council reports that only 64.4 percent of all new history PhDs in 1995 were employed in four-year colleges and universities. Finally, an indeterminate but probably large proportion of academic jobs for new PhDs are temporary or part-time, bringing into question job statistics that do not distinguish between positions that provide opportunities for professional careers and jobs that are likely to be short term and/or poorly paid.1
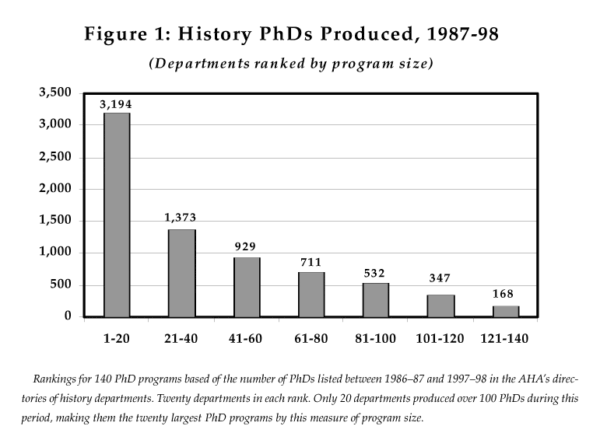
Figure 1
To analyze the relationship between PhD production and the recent job market for historians more precisely, I have established a database that links together information about individuals who earned PhDs between 1989–98 with information about individuals employed in history departments during the current academic year (1998–99).2 This methodology makes it possible to compute employment rates for annual cohorts of history PhDs, and to distinguish between the employment of PhDs produced by large graduate programs and those produced by smaller programs. Comparative analysis of PhD production and employment by the size of programs clarifies two kinds of inter-related questions about the current job crisis for historians: to what extent has the increasing supply of history PhDs been caused by expansion in the size and effectiveness of many PhD departments, as compared with the few departments that have traditionally dominated the production of history PhDs in the United States, and to what extent has program size been related to the employment of recent PhDs in tenure-track positions as historians?
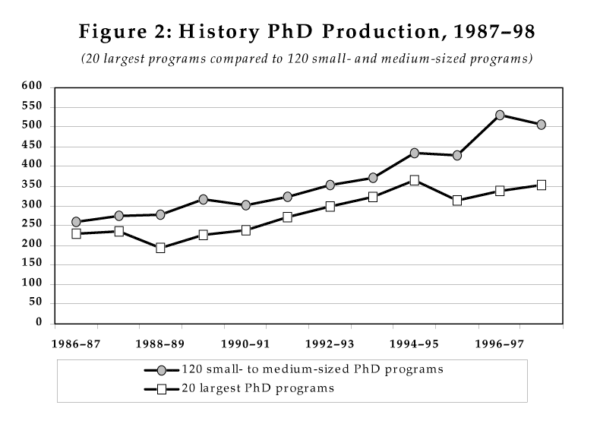
Figure 2
To answer these questions, I have classified 140 PhD programs into 7 categories (20 in each) on the basis of the number of PhDs listed between 1986–87 and 1997–98 in the AHA’s Directory of History Departments. Only 20 departments produced over 100 PhDs during this period, making them the 20 largest PhD programs by this measure of program size.3 The PhD production of other graduate programs during this 12-year period varied from 54–99 in the second group of 20 departments, 41–54 in the third group, 32–41 in the fourth group, 22–31 in the fifth group, 14–21 in the sixth group, and 2–14 in the seventh group.4 Figure 1 shows the total number of PhDs produced by all the programs in each of these size-categories. It illustrates the extent to which PhD production has been concentrated during the past 12 years in the 20 largest programs, which account for 44 percent of all the history PhDs reported in AHA directories by the 140 programs included in the figure.
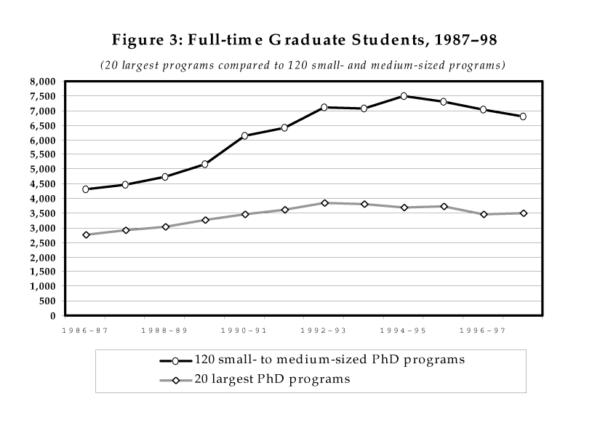
Figure 3
The annual number of history PhDs listed in AHA directories increased from 487 in 1986–87 to 861 in 1997–98, with an even higher peak of 913 in 1996–97. Analysis of three-year cohorts shows an increase of 72 percent in the number of PhDs awarded between 1986–89 (1,467 PhDs) and 1995–98 (2,521 PhDs). Figure 2 compares the annual production of PhDs in the 20 largest programs and the 120 medium-sized and small programs. Both categories of programs increased their output considerably, but an increasing proportion of all PhDs were produced in the 1990s by the smaller programs. Analysis of three-year cohorts shows that the 120 medium-sized and small programs increased their PhD output by 81 percent between 1986–89 and 1995–98, as compared with an increase of 53 percent in the PhD output of the 20 largest programs. The share of all PhDs produced by the 120 smaller programs increased from 55 percent during the three-year period from 1987–90 to 59 percent in the three-year period from 1995–98.
Is this upward trend in PhD production likely to continue? Figure 3 shows that the number of full-time graduate students climbed steeply in the early 1990s, peaking in the largest programs in 1992–93 and in the smaller programs in 1994–95. A downward trend has begun recently, but if we compare the size of programs in 1986–89 with those in 1995–98, we find an increase of 56 percent in the smaller programs and 23 percent in the large programs. The data on the enrollment of new graduate students, as presented in Figure 4, shows an even more striking contrast between the largest programs and the smaller ones. The largest programs did not increase their enrollments at all in the early 1990’s and they have reduced their new enrollments substantially in the last several years. Analysis of three-year cohorts shows that new enrollments in these large programs declined by 37 percent between 1987–90 and 1996–99. By contrast, the smaller programs expanded new enrollments by 28 percent between 1987–90 and 1990–93 and then returned to their earlier levels later in the 1990s, resulting in a net decline of only 1 percent in new enrollments over the 12-year period. The smaller programs have increased their share of new enrollments of graduate students from 72 percent between 1987–90 to 80 percent between 1996–99.
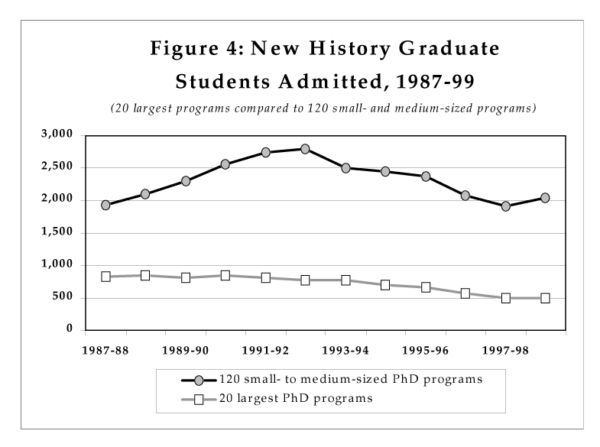
Figure 4
During the past four years, the AHA Directory has published lists of dissertations in progress, although not all PhD departments have reported this information. Figure 5 shows the trend among departments that did report this data in all four years. It classifies the data by the rank-size of programs and shows an upward trend between 1995 and 1997 across all program sizes, followed by a decline last year mainly in the largest programs. If we compare the totals for 1995 and 1998, we find an increase of 20 percent in dissertations in progress in the 20 largest programs, and a much sharper increase of 58 percent in the total number of dissertations in progress in the smaller programs. This data suggests that PhD output is likely to continue to grow for several years, especially from the medium-sized and small programs, before levelling off in response to recent declines in new enrollments.
By contrast with the considerable increase in the production of history PhDs during the 1990s, relatively few history departments have expanded the size of their tenure-track faculty since 1990. Among the 580 history departments in the United States whose faculty were listed in the AHA directories for 1990–91 and 1998–99, the total number of full-time or joint appointments of historians as assistant, associate, or full professors increased by only 1 percent, from 8,471 in 1990–91 to 8,568 in 1998–99. This gain of 97 positions resulted from an increase of 111 tenure-track appointments in the 269 private colleges listed in both directories, which counterbalanced a decline of 14 tenure-track appointments in the 311 public colleges and universities listed in both directories.
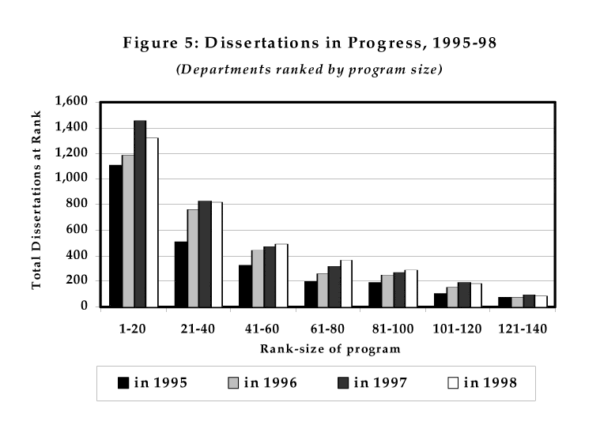
Figure 5
Of course, this analysis does not take into account replacement positions for retiring faculty. Indeed, according to the AHA Directory in 1998–99, the 580 departments that added a total of only 97 additional faculty since 1990–91 were, nonetheless, employing in tenure-track positions a total of 1,631 individuals who received their PhDs from history departments in the United States between 1989–98.5 Two-thirds of these positions (1,087) were in public colleges and universities, as compared with 316 in independent colleges and universities, and 228 in religiously affiliated colleges and universities. Among the public universities, departments offering graduate degrees in history have played an especially prominent role in the hiring of the PhDs produced in the past nine years, accounting for 518 of the 735 tenure-track positions in PhD-granting departments held by this cohort of PhDs, and 426 of the 512 tenure-track positions held by this cohort in MA-granting departments.
The relative importance of retirement positions in the hiring of history departments not listed in the 1990–91 and 1998–99 directories cannot be estimated, but these positions need to be included in any comprehensive analysis of the employment of history PhDs in academic jobs. On the basis of lists of history faculty in 674 departments in the United States that were listed in the 1998–99 AHA Directory (including 94 not listed in 1990–91), 38 Canadian history departments listed in the 1998–99 AHA Directory, and information about history faculty on the web sites of 437 colleges and universities not included in the 1998–99 directory, I have identified a total of 2,191 history PhDs produced between 1989–98 by the 140 graduate programs classified above who held full-time or joint appointments as assistant, associate, or full professors at the beginning of the current academic year (1998–99).
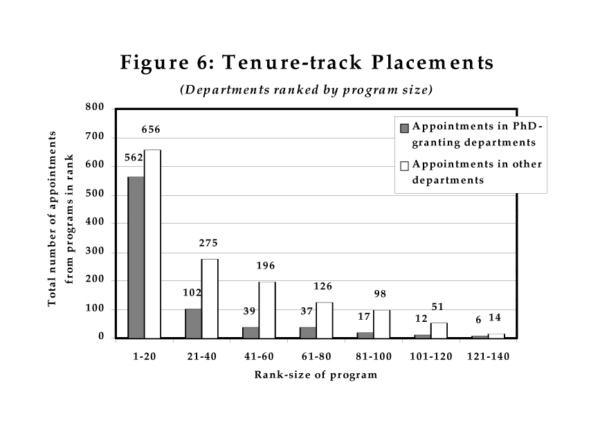
Figure 6
On the basis of this employment data, the market for PhDs in the 1990s can be analyzed from two perspectives: that of the history programs that produced these 2,191 PhDs and that of the history departments that hired them. Figure 6 synthesizes both of these perspectives by showing the distribution of these tenure-track jobs by the size of the graduate programs that produced them. It distinguishes between employment in history departments that have PhD programs (the dark columns) and employment in history departments that do not have PhD programs (the light columns). This figure highlights the dominant position of PhDs from the 20 largest graduate programs in the high end of the job market, that of tenure-track positions in research universities. Nearly three-quarters (72.5 percent) of the PhDs since 1989 holding tenure-track jobs in PhD-granting departments of history received their degrees from one of the 20 largest graduate programs.
Graduates from the largest programs also hold a disproportionate share (46.6 percent) of the tenure-track positions in history departments that do not offer PhD degrees. However, such departments, which range from small private colleges with BA degrees to large state universities with MA as well as BA degrees, comprise the main job market for graduates from the smaller programs. They account for 73 percent of all the tenure-track jobs held by graduates from the second tier of departments, 83 percent of those from the third tier, 77 percent of those from the fourth tier, 85 percent of those from the fifth tier, and 81 percent of those from the sixth tier of departments, as compared with only 54 percent of the tenure-track jobs held by graduates from the 20 largest departments.
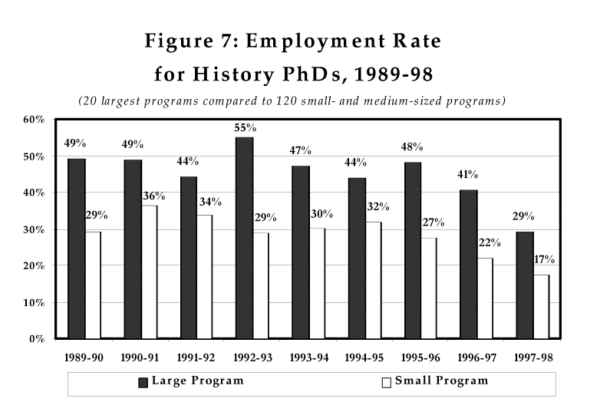
Figure 7
Figure 7 presents employment rates for each annual cohort of PhDs, based on the proportions of PhDs who held tenure-track jobs in history departments in 1998.6 The figure distinguishes between PhDs from the 20 largest PhD programs (the dark columns), and those from the 120 other programs under study (the light columns). It dramatizes the relatively strong market position of PhDs from the 20 largest programs, whose employment rate in tenure-track jobs exceeds 40 percent for each of the cohorts from 1989–90 through 1996–97. The fall to 29 percent in the most recent cohort is probably misleading because a large number of these PhDs would have been only ABDs when they entered the job market last year.
By contrast, the employment rate in tenure-track jobs for PhDs from smaller programs ranges from 36 percent for the cohort that graduated in 1990–91 to only 27 percent for the 1995–96 cohort, 22 percent for the 1996–97 cohort, and 17 percent for the 1997–98 cohort. This downward trend in employment rates is the counterpart, of course, of the explosive growth in the number of PhDs produced by these programs in recent years.
In conclusion, this data on the production and employment of PhDs casts doubt on optimistic projections about the academic job market for historians. Growth in PhD production is likely to increase for several years, even if medium-sized and small programs follow the lead of the largest programs in reducing the size of their entering classes of graduate students. Whatever the trend in retirements, which is the main factor influencing the academic market for historians, new PhDs face competition from the huge backlog of over 4,000 history PhDs since 1989 who do not yet have tenure-track jobs in history departments. Graduates from the many small PhD programs are especially likely to be disappointed in this kind of a job market. Even many PhDs from the largest graduate programs, which produced around 1,500 PhDs between 1989–98 who are not currently employed by history departments in tenure-track jobs, will need to find alternatives to academic employment.7 A tight job market is likely to constrain the employment opportunities of history PhDs over the next decade, regardless of where they have earned their degrees.
Notes
- Robert Townsend, “PhD Production Dropped Slightly in 1996,” Perspectives 36:7 (October 1998), p. 6; and Townsend, “1998 Job Market Report: Retirements Create More Opportunities but Job Gap Remains,” Perspectives 37:1 (January 1999), 3, 22–24. [↩]
- The database consists of 6,292 individuals awarded PhDs by history departments in the United States during the nine-year period from 1989–90 through 1997–98, as compiled from the lists published by the AHA in its annual Directory of History Departments and Organizations. A total of 1,839 of these PhDs held full-time or joint appointments as assistant, associate, or full professors in U.S. or Canadian history departments, as listed in the Directory of History Departments and Organizations in the United States and Canada, 24th edition, 1998–99 (Washington, D.C.: American Historical Association, 1998). I found another 359 of these PhDs listed as assistant, associate, or full professors of history on the web sites of four-year colleges and universities that were not included in the Directory, including 9 PhDs employed by Australian universities. Employment rates based on this data are reasonable estimates of the proportions of PhDs with tenure-track positions in history departments, but historians employed in other programs are not included unless they have joint appointments with history departments. [↩]
- In descending order of number of PhDs awarded, these history departments are California, Berkeley (265), Columbia (253), Chicago (242), UCLA (232), Yale (226), Wisconsin-Madison (219), Michigan (182), Harvard (152), Stanford (144), Indiana (137), Johns Hopkins (133), Princeton (130), Ohio State (127), Rutgers (117), North Carolina (111), NYU (107), Illinois, Urbana-Champaign (105), Texas, Austin (105), Minnesota (104), and Pennsylvania (103). These tabulations are based on PhDs reported in the AHA directories from 1987–88 (for degrees awarded in 1986–87) through 1998–99 (for degrees awarded in 1997–98). [↩]
- In cases of ties in the number of PhDs produced, departments have been classified in the higher or lower category depending on the number of PhDs produced in the past five years (1993–98). Four history of science programs have been included (Harvard, Wisconsin, Johns Hopkins, and Oklahoma), but two programs that discontinued the PhD degree (Bryn Mawr and Wyoming) and five programs that each awarded only one PhD between 1986–98 have not been included. [↩]
- This tabulation is based on the individuals listed in the AHA directories between 1990–91 and 1998–99 as recipients of PhDs from history departments in the United States during the academic years 1989–90 through 1997–98. [↩]
- These rates are based on employment in full-time, tenure-track jobs as assistant, associate, or full professors in the history departments of any of the 1,349 four-year colleges and universities included in this study. They should not be confused with the overall employment rate of history PhDs from each cohort in academic jobs, which would include the following additional types of positions: (1) instructors and lecturers; (2) visiting, adjunct, and part-time appointments as assistant, associate, or full professors; (3) tenure-track positions in interdisciplinary programs that are not listed in the AHA history directory or on the web sites of other history departments; and (4) jobs in two-year institutions. [↩]
- A few of the 1,512 PhDs produced by these large programs since 1989 whom I have not been able to identify as holders of tenure-track jobs in history departments may have died, and some may hold tenure-track jobs in departments about which I have not found any information (including universities in Europe, Latin America, and Asia), but a substantial number probably do not currently hold full-time academic positions. [↩]
Ted W. Margadant is professor of history at the University of California at Davis.


