 Each year, the AHA presents an article with information collated from our Career Center advertisements to represent the academic job market for historians (as we call it), or, less precisely, “the job market” (as many others term it). Featuring heart-stopping graphs and numbers, the piece usually implies that there’s a quantifiable “market” that can be summarized in a simple visualization. But we’ve become less satisfied with this type of article, because it’s clear that the clean surface of a graph fails to capture the many and diffuse professional opportunities open to historians.
The idea of a singular job market for historians stems from still-powerful conceptions of what a history job looks like. Academic jobs are advertised in a number of forums, raising questions about whether any single source of postings fully represents academic hiring trends. By relying on data from the AHA Career Center, the AHA (and our members) risks succumbing to what social scientists call a “streetlight” problem—looking for answers in the places that are already illuminated instead of in the shadows, even though searching through both is most likely to produce accurate results. In recent years, we have experimented with compiling data from H-Net, another leading source of academic job listings, to ensure the comprehensiveness of our annual jobs report.1 This year, H-Net once again generously shared its advertising data with us. Although the combined data allow for a fuller accounting of the state of the academic job market, they also raise fundamental questions about what it means to quantify it, especially since historians find employment opportunities beyond the professoriate, in altogether different job markets.
The Challenge of Quantifying Markets
The AHA Career Center ran ads for 529 positions in 2016–17, all but a handful for full-time work. As we reported in November, this was the lowest total number of advertisements since Ronald Reagan was president. During the same period, H-Net ran an additional 549 unique ads for positions either in history departments or open to historians. Adding them together suggests that there were 1,078 history and history-adjacent jobs last year. But what exactly is being counted? Adding up job ads does make basic arithmetic sense, but the resulting number obscures more than it reveals about the academic job market.
Perhaps the most straightforward category of history jobs is faculty positions in history departments, whether on or off the tenure track. The AHA is working to dislodge the notion that these listings serve as a proxy for the career options available to historians. Nevertheless, they are the traditional starting point of our annual jobs report and are closely watched by early-career historians. The AHA Career Center featured 295 tenure-track positions, 222 of them in history departments. H-Net turned up another 118, for a total of 340 tenure-track jobs in history. Between the two sources of listings, 166 non-tenure-track and visiting positions were advertised, a figure that suggests that there were approximately 500 academic jobs in history departments during 2016–17.
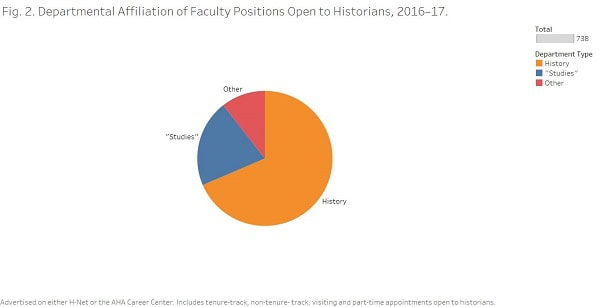
These are the most stable and easily quantifiable numbers we can present, but they only account for about three quarters of the faculty positions advertised in the AHA Career Center, which posted listings for more than 100 openings (tenure and nontenure track) in departments other than history. These are positions we call “open to historians,” a useful but slippery category.
The most stable and easily quantifiable numbers we can present only account for about three quarters of the faculty positions advertised with the AHA.
Like the AHA Career Center, H-Net lists many jobs that fall into this category. Adding them up, however, requires careful judgment. When employers place ads with our Career Center, we can assume that they are interested in applicants with a PhD in history. But H-Net is a source of listings in multiple disciplines, not all of which are appropriate for historians. Obtaining a realistic number using H-Net data involves reading individual ads and deciding which would make a good fit for a historian. Some women’s studies jobs, for instance, seemed to favor social theorists or social science PhDs trained in quantitative analysis. A job ad from a Korean studies department calling for a specialization in contemporary film, TV, and social media might be a history job—there is almost certainly a historian out there who could fill the vacancy—but PhDs from Asian studies, media studies, and other disciplines are more likely to compete for such a position. Instead, analyzing ads in which the past or historical thinking figures in the desired areas of expertise provides a reasonable count, even if an irreducible fuzziness remains around the edges.
Some historians do find work in departments such as religious studies or American studies. How often this happens is unclear, but the AHA’s Where Historians Work project, which tracks the career outcomes of all history PhDs earned from 2004 to 2013, suggests it is relatively rare. Our data set, currently comprising more than 6,000 history PhDs, has so far turned up only 17 with tenure-track appointments in religious studies, for example—an average of less than 2 per year. Area, ethnic, and cultural studies departments combined hire roughly 12 historians annually.
The 206 different postdocs advertised by the AHA and/or H-Net pose perhaps even greater difficulties, as most of them are open to PhDs from disciplines across the humanities and social sciences. Less than a quarter of all the postdocs advertised last year were specifically targeted at historians. We lack the data to quantify how many historians earn postdoctoral fellowships in any given year, but surely their numbers are much smaller than the total number of available positions.
In other words, we have data on faculty and postdoc jobs, which we can begin analyzing with confidence. Much more difficult to quantify is the wide range of jobs that are truly open to historians. We now recognize that 20 to 25 percent of history PhDs will build careers outside the ranks of the faculty. Some find their positions through ads in the AHA Career Center or on H-Net. Combined, the two job boards advertised 136 such positions in 2016–17. AHA ads for these kinds of positions have increased over 400 percent in the past two years, a trend we hope will continue. Nonetheless, it’s clear that we will never host even a fraction of the total that exists, even though we know that many careers “open to historians” are out there. The value of these positions and their importance to understanding the careers of historians is more important than ever. But how should they be integrated into our annual jobs report—if they are at all? At the very least, the increasing number of ads for jobs beyond the professoriate adds to our wariness about presenting a straightforward or definitive quantification of history jobs.
Conclusions
The question of what the job market for historians looks like is still an open one, but the framework for a new answer is starting to become clear. First, we need to fully abandon the idea of a singular job market. This means more than simply emphasizing the existence of two markets, the academic and the nonacademic; it also involves recognizing that there are multiple markets both outside the academy and within it. As historians, we know that one way to do this is to question the limits and biases of the primary sources we use as evidence. Another method we know well is to diversify our source base in search of fuller perspectives.
By relying on only AHA data, we risk looking for answers in the places that are already illuminated instead of in the shadows.
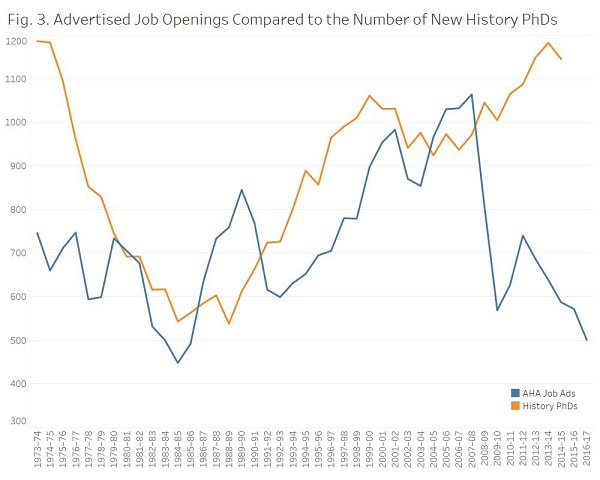
We are still piecing through what this means, but a few key ideas—at least in relation to our annual feature on jobs in history—are coming into focus. Perhaps the most important of these is the need to reconceptualize what has long been the signature representation of history careers: a double line graph displaying “history” job listings and PhDs awarded. These charts have traditionally provided the foundation for hope or despair at the distance between the lines.
While the number of PhDs earned annually is easy to quantify, the number of jobs, even academic jobs, open to historians in any given year is subject to much greater uncertainty. Anecdotal evidence of a contracted academic job market and the best available data both support the basic trends reflected in the AHA Career Center advertisements. Recent research by Robert B. Townsend on history department rosters, for instance, has found that the number of new assistant professorships in 2016–17 was less than half the number of new hires in 2004–05. There is no question that there are fewer tenure-track positions than the number of well-qualified PhDs who would like to fill them. But it also evident that this workhorse underestimates both demand and the supply of jobs open to historians, even as it visually reinforces the idea that in a perfect world its twin lines would converge. The question remains: How best to quantify the job markets that historians navigate?
Note
- Allen Mikaelian, “The 2013 Jobs Report: Number of AHA Ads Dip, New Experiment Offers Expanded View,” Perspectives on History (January 2014); Allen Mikaelian, “The Academic Job Market’s Jagged Line: Number of Ads Placed Drops for Second Year,” Perspectives on History (September 2014). [↩]
This work is licensed under a Creative Commons Attribution-NonCommercial-NoDerivatives 4.0 International License. Attribution must provide author name, article title, Perspectives on History, date of publication, and a link to this page. This license applies only to the article, not to text or images used here by permission.


