 In the good old days, it is said, the people—mostly men—who became historians were like Henry Adams: independently wealthy and/or married (in the formal or informal sense) to women who assured their standard of living. If it ever prevailed, that situation hardly exists today, when historians are working people. We support ourselves in jobs that are largely but not entirely in institutions of higher learning. With working people’s anxiety about employment, which translates directly into “subsistence” as well as “professional career,” young historians are likely to be obsessed with the job market and sometimes to reduce it to unsettlingly concrete terms.
Inevitably in hard times—which in academia have been with us more or less since the mid-1970s—whatever affects the workings of the market frightens those who are in it as sellers. Since the late 1970s, the term that has produced the greatest amount of paranoia has been “affirmative action.” In light of the rhetorical power of affirmative action and its ability to induce fear, my discussion, though beginning with numbers of historians with doctorates entering the job market, ends with comments about affirmative action and job discrimination.
Some Demography of the Supply of PhDs in History
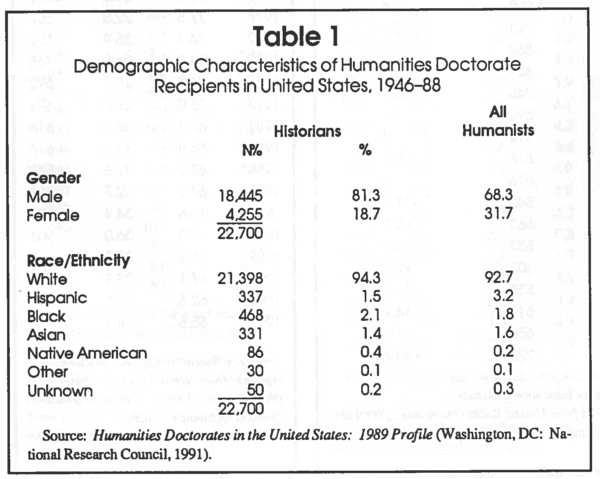
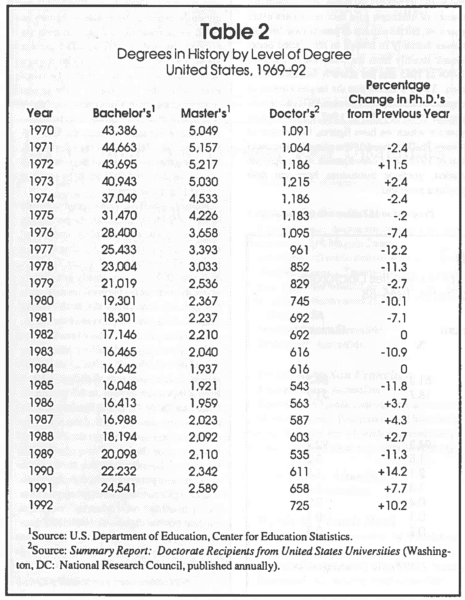 Table 1 establishes a baseline for the profession and shows that the generation of historians active between 1946 and 1988 numbers 22,700, of whom more than 80 percent are male and nearly 95 percent are white. It may seem that masses of historians gain their doctorates every year now, but the number of people awarded doctorates annually in history in the United States shrank steadily from the recession of the mid-1970s to 1985 and has scarcely increased since then. Table 2 shows that the largest number of degrees awarded (1,215) was in 1973, the lowest number (543) in 1985. In 1992, the most recent year for which we have figures, the number of history PhDs awarded was about 60 percent of that of 1973. As a consequence of the tight job market, graduate institutions have cut their graduate programs.
While total numbers of annual doctoral recipients in history have dropped, Table 3 shows that the proportion of PhDs awarded to women has increased, from a bit more than one-eighth in 1970 to just over one-third in 1992. Yet at no point between 1981 and 1992 did women earn as many as 40 percent of the doctorates awarded in history in the United States. The absolute number of women receiving history PhDs yearly increased only during the earliest part of the period covered in Table 3, from 1970 to 1976, and has fluctuated around an average of two hundred per year. In the early 1980s, the number of women annually receiving history doctorates remained fairly steady while the number of men declined.
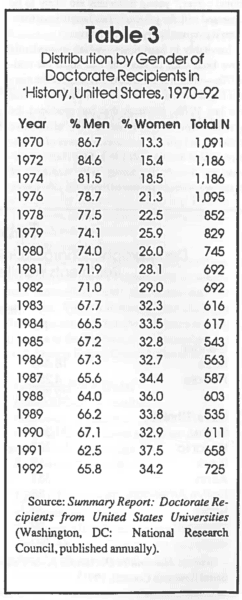 As dramatic as women’s progress in gaining doctorates in history is, other fields in the humanities and social sciences seem to be further along toward gender parity. In 1992 women earned 47.4 percent of doctorates awarded in the social sciences and 46.3 percent of the humanities doctorates. Men seem to be holding their own better in history than in other comparable fields.
While the proportion of white and nonwhite women receiving doctorates in history is hovering just under 40 percent, the proportion of young racial/ethnic historians has rarely exceeded 10 percent. As Table 4 shows, the number of minority recipients increased from 1975 to 1979 but has fluctuated around an average value of forty-five since then. From a statistical point of view, the number of minority recipients has been much more stable than the total number of recipients, showing no more variation than would be expected from the Poisson model for random variation.
The very stability of the numbers of racial/ethnic historians receiving history doctorates suggests that they are more supply driven than the overall numbers of history PhDs, which have fluctuated more (relative to random variation), presumably because of changes in graduate school admissions policies. The relatively low level of the numbers for minority recipients suggests that the increase in the percentage in the 1980s over the early 1970s has not been achieved entirely by enlarging opportunities for the hitherto excluded; the overall decline in absolute numbers of young historians receiving PhDs has also been crucial.
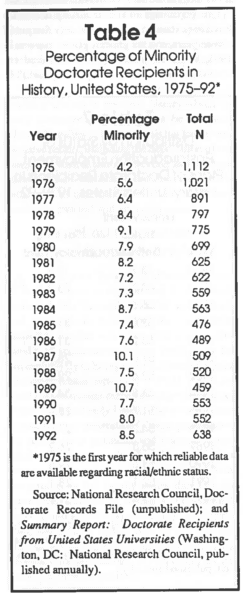 Paul Conkin’s Perspectives article (“Bleak Outlook for Academic History Jobs,” April 1993) shows that the percentage of college and university students who belong to racial/ethnic minorities is now around 17 percent nationally, while the percentage of minority people ready to enter history faculties hovers around 8 percent. This disparity is bound to present some frustration to institutions desiring to diversify their faculties, particularly in the West, where students are more likely to be Native American or Chicano.
Table 5 breaks down racial/ethnic minorities by group and shows that the proportion of history PhDs who are Native American remains infinitesimal, with Latinos and Asian Americans doing little better. The bulk of history PhDs who belong to racial/ethnic minorities consists of African American and “Unknown.” Unknowns represent substantial proportions that regularly exceed the percentages of Native American and Latino doctoral recipients in history, particularly in the 1970s and 1990s. In the mid-1970s, when the historians who are now senior scholars were receiving their degrees, a larger proportion of Unknowns were getting doctorates in history than Native Americans, Asian Americans, African Americans, and Latinos combined.
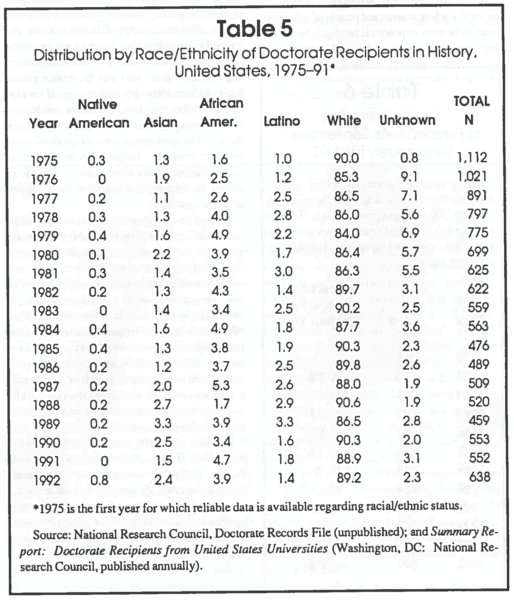
Table 5
In statistical terms, the percentages of minority doctoral recipients over the last generation show no clear trend overall, for the absolute number of nonwhites remains low and subject to relatively large fluctuations. The years in which the proportion of PhDs who were white declined markedly below 90 percent are years in which the racial/ethnic proportions rise, and in which the Unknown category is more than about 3 percent, e.g., 1977–81. Table 6, together with the preceding table, indicates that the proportion of history PhDs who are white and male has held fairly steady at about 57 percent.
So Much for Supplies of PhDs—What About Jobs?
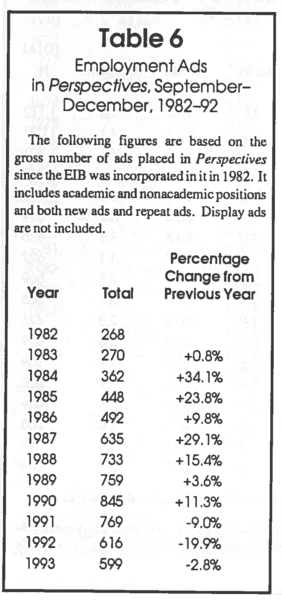 The first thing to be noted about the data in Table 6 is the increase in the number of jobs advertised in Perspectives between 1982 and 1993. Although subject to dramatic fluctuations, the number of jobs advertised from year to year has tended to increase since the early 1980s. The increase, I suspect, reflects the impact of affirmative action policies, which mandate that jobs be advertised openly.
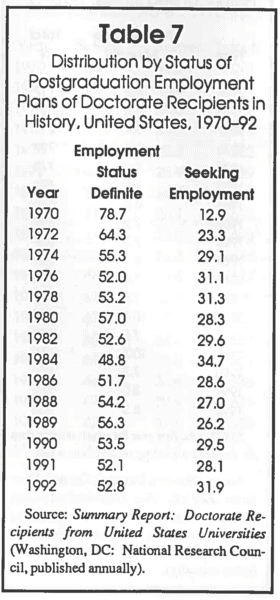
Of course, routinization of hiring has not brought a smoothing out of demand, which remains closely tethered to the economic climate. The number of jobs advertised grew in the 1980s, sometimes quite dramatically. Then, in the early 1990s, when the economy sagged, the job market collapsed. If the trend continues, the number of people admitted to graduate school will decline again and, in turn, the number of PhDs awarded will go down, as in the early- to mid-1980s. The result of the economic roller coaster of the 1980s and early 1990s is evident in Table 7.
At the end of the cushy 1960s, when the great majority of history PhDs got jobs, over 80 percent of history PhDs were securely employed when they received their degrees. Since then, however, history PhDs have not been able to take job security for granted; substantial minorities of doctoral recipients have continued to seek employment or to accept insecure or inappropriate positions. Such uncertainty has resulted in the understandable if not attractive paranoia about jobs that has sometimes focused on the phrase “affirmative action.”
Affirmative Action, Symbolic Competition, and Confounded Fields and Bodies
Since the mid- to late-1970s American institutions, including colleges and universities, have attempted to diversify their work forces so as to approximate more closely the United States population. Whereas the history faculties of an earlier generation were exclusively white and male—except in institutions serving minorities and/or women—current faculties are far more likely to be diversified by sex, race, apparent sexual preference, and religion. The mechanism for employing white women and people of color has been affirmative action, which has myriad meanings and levels of stringency, from pious statements without means of implementation to jobs that are funded only when a minority candidate can be hired.
 In the first instance, affirmative action has meant that white women and people of color have come to be seen as potential faculty in novel settings, transforming the unthinkable into the plausible. Racial/ethnic women, for instance, are now accepted in faculties that had been all white and all male in the 1960s and 1970s.
Affirmative action has also entailed positive changes in hiring that affect most job candidates and that are taken for granted, such has the open advertising of positions in the Employment Information section of Perspectives and the Chronicle of Higher Education. Procedures implemented toward the aim of diversifying the applicant pool have also had the effect of distributing knowledge about positions among job seekers generally, thereby improving the prospects of job seekers who are not plugged into the old-boy networks. Because the legislation that undergirds affirmative action, the Civil Rights Act of 1964, also prohibits discrimination in hiring and in the workplace on account of religion, as well as sex and race, it has discouraged discrimination in hiring generally.
Unfortunately, favoritism and unfair advantage have not been entirely eliminated, but they are no longer accepted as routine, which is a good thing. According to anecdotes told to me by older colleagues, a very different pattern prevailed before affirmative action: A senior professor’s protégé, who needed a job would visit a departmental chair who was the senior professor’s old friend from graduate school; if the aspirant could play tennis nicely and if he and his wife had the requisite social skills, the young man got the job. No open competition to speak of—connections were all. Despite the unfairness and closed nature of this older pattern, it never received the calumny that has been voiced against affirmative action.
Most often, people who oppose affirmative action (and they include some members of minority groups, who believe that it stigmatizes them as “unqualified”) think of such policies as the enemies of merit, as though minorities are, by definition, unqualified, while nonminorities are, by definition, qualified. The phantasm of affirmative action has also inspired a sort of paranoia among white men who are afraid they will never get jobs. Their apprehensions focus less on economic hard times than on people of color, especially black women, who seem to represent a kind of competition that can never be beaten. To that panic I have two responses.
The first is that the numbers still favor white men. Even if a racial/ethnic woman were to be the first choice of several history departments, she could only accept one job. The other jobs go to other people, very few of whom are women of color, many of whom are white men and women. A recent analysis of statistics from the National Research Council concludes:
Women of color constituted only 3.1 percent—17 doctoral recipients out of 552 in 1991. The total number of history doctorates awarded to women of color since the NRC began collecting data in 1975 is only 241—2.2 percent of the total number of history doctorates awarded in those years and less than the number of history doctorates earned by white males in 1991 alone. (James B. Gardner, “Jobs Lag as New PhDs Continue to Increase,” Perspectives [January 1993].)
There simply are not enough women of color receiving doctorates in history to affect the chances of white men in any but the slightest degree. The main competition of white men in the history profession continues to be first, other white men, then white women. The fear is that women, particularly women of color, will be hired before white men. I have no figures regarding the employment rate of minority women, but women generally are not employed quite as readily as men, as the analysis of NRC data indicate: “[T]he percentage of female history doctorates hired has exceeded that of males only five out of eleven years, and the greatest gender gap was in 1991, when the percentage of men hired exceeded that of women by 12.6 percent. (Ibid.)” In short, men are doing somewhat better than women in the job market. The significance of the great affirmative action fear seems to be more symbolic than quantitative.
There do exist actual distortions of the job market that aggravate job seekers’ frustrations, one of which is the unfortunate practice of using jobs intended to diversify predominantly white male faculties to fill positions related to particular fields. This custom has meant that teaching positions in fields such as Latin American, African American, Native American, and Mexican American history have gone unfilled and courses untaught year after year, because departments will not hire nonminorities for such positions. Given the shortage of minority history PhDs, crucial fields can languish if an institution is not successful in its search for minority faculty.
In addition to depriving students of valuable courses, this kind of stereotyping reinforces anti-intellectualism. The idea that only black people can understand and teach black history is just as narrow-minded as the notion that only people of European descent can teach and understand European history. Both ideas are regrettably widespread, and both cramp the teaching and learning of history.
The two aims—diversifying faculties and teaching courses in minority history—both entirely commendable, should not be confused. The confounding of the two goals has had several negative results, including the deprivation of students who want to take courses that lack teachers, the conduct of misleading searches, and the embitterment of nonminority scholars. Both aims need to be pursued without being mixed up.
The “Lost Generation” and Spouse Policies
As positive are the aims of affirmative action with regard to regularizing hiring overall and increasing the employment of white women and racial/ethnic minorities, they sometimes come into conflict with other worthy goals. One bundle of requirements relates particularly but not exclusively to hiring women: spouse policies. The other relates especially to PhDs who entered the job market during the depression years of the 1970s and early 1980s, who are sometimes termed the “lost generation.” These people never got tenure-track positions and became “gypsy scholars” or part-time faculty. They have often been marginal and/or peripatetic for years. Without stability or full faculty status, they lack the leave time, collegiality, library access, research support, and intellectual sustenance that tenure-track and tenured faculty take for granted, and without which the scholarship and publication necessary for professional advancement are extremely difficult to achieve.
History departments sometimes discriminate against the “lost generation” by stipulating the applicants have received the PhD after a given, quite recent date. Such a limitation makes no sense intellectually; it is discriminatory and most often harms scholars who have achieved against enormous odds.
Historians of the “lost generation” may be particularly well suited for the job market of the 1990s, by virtue of having taught a variety of courses. It appears that jobs in history will continue to become less specialized than in the past, making teachers who are comfortable with a variety of teaching assignments and able to teach broad-based survey courses ever more valuable. Wasting the experience of historians who have honed their skills in a market that demands versatility of them as teachers would inflict a great loss on our evolving profession.
Affirmative action ideals also can conflict with spouse policies, and here I can offer no hard and fast guidelines, for a flexible spouse policy can make it possible for institutions to attract and keep female and racial/ethnic faculty whose spouses may or may not also belong to minority groups. The increasing prevalence of historians who are married to other historians or other academics presents departments and institutions with challenges that they have previously avoided on the ground that they could in good conscience avoid involvement with personal matters. But, as feminists say, the personal is the political (here, the academic). If faculties are to diversify they will need energetic and flexible spouse policies, and they will need to realize that a spouse is not necessarily someone who can be legally married to the job candidate. In order to be fair to the several experiences of faculty, history departments need to remain sensitive to several kinds of needs at once.
In sum, the supply of history PhDs has changed drastically in absolute terms, with the annual numbers falling by nearly half since the early 1970s. But while women earn approximately a third of doctorates awarded annually in history, women in history still lack the presence of women in other liberal arts fields. Racial/ethnic minorities have not dramatically improved their proportional representation in the history profession, although their numbers have risen since the 1970s. White men in the job market have the drastic reduction of the number of jobs to fear, but their main competitors continue to be other white people, men more than women. In a shrinking job market, competition grows fierce. Nonetheless, historians who have been peripatetic and/or underemployed ought not to be carelessly shunted aside.
