Editor’s Note: For wider context on these annual snapshot figures, be sure to read “The Ecology of the History Job: Shifting Realities in a Fluid Market,” by Robert Townsend in the December 2011 issue of Perspectives on History.

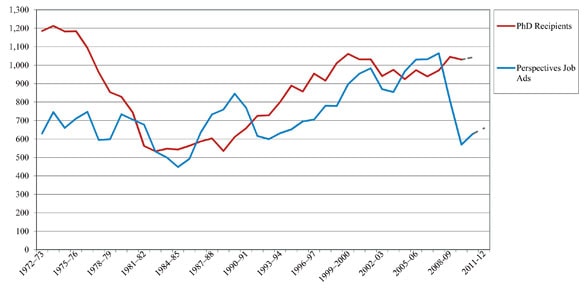
Figure 1: Number of History Ph.D.’s and Advertised Job Openings, 1970–71 to 2011–12. Source: Data on Ph.D. recipients from annual Doctorate Recipients from United States Universities: Summary Report, supplemented for last year by estimate based on the latest reportings to the annual Directory of History Departments. Data on job openings is a simple count of the first listings of jobs in Perspectives on History or the AHA’s online Employment Information site (which eliminates duplicates but does include senior, public history, and one-year fellowships).
After two years of sharp declines, the history job market finally stabilized and showed some modest improvements last year. The number of jobs advertised in 2010–11 increased 10.2 percent from its nadir the year before (Figure 1), and the number of full-time faculty employed in history departments this past fall increased slightly.
Nevertheless, a survey of last year’s advertisers shows the number of historians competing for jobs also continued to grow, as the number of new PhDs conferred and the number of doctoral students advancing toward the degree remain at very elevated levels (with another small uptick in the number of PhDs reported to the annual Directory of History Departments, Historical Organizations, and Historians).
Even though advertisements this year continued to grow—up another 6.2 percent as of December—history is noticeably lagging behind improvements in the academic job markets for other disciplines. Economics, modern languages, and sociology have all reported more substantial rebounds in the number of job advertisements for their fields.
A (Modest) Rebound for Most Fields
The number of job openings advertised through the AHA increased from 569 to 627 last year. While this remains well below the historical high of 1,064 positions advertised two years ago, it at least represents a turnaround after two years of unprecedented declines.
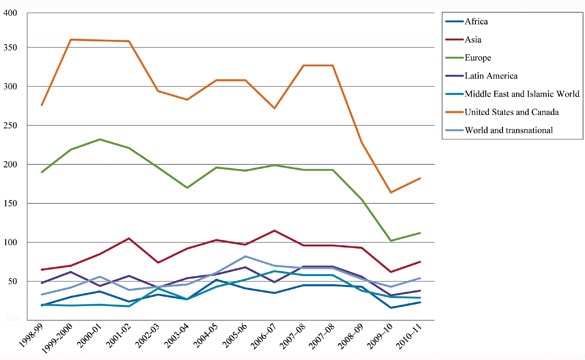
The improvements extended across almost every major field of specialization (Figure 2). The number of positions advertised increased in every category except the history of the Middle East and Islamic world, where the number of positions fell by one (from 30 to 29).

Figure 2: Trend in Positions Advertised in Subject Field, 1998–99 to 2010–11
The field of African history, which had experienced the sharpest proportional decline the year before (a drop of 62.8 percent), saw the largest relative increase in new job postings last year—a 43.8 percent gain, albeit from just 16 to 23 openings. Openings for specialists in the fields of world, Asian, and Latin American history also increased by more than 20 percent.
As usual, the largest number of jobs advertised was in the history of North America, which accounted for 182 openings last year—up from 164 the year before. Advertisements for positions in the history of Europe also increased slightly, from 102 to 112.
Of the jobs posted, 69 percent were for tenured or tenure-track positions, which was down modestly from the mix of jobs posted before the recent crash (when the proportion of tenure-eligible and tenure-track postings was around 75 percent). Another 15 percent were listed as only “temporary” appointments, while the remaining 16 percent were not traditional academic appointments—typically because they were either for fellowships and postdoctoral appointments, at institutions that lack a tenure system, or nonteaching public history positions.
Mixed News from Advertisers
To help clarify what we can glean from the text of the advertisements, we supplemented our information with a survey of advertisers, which asked about the course of the job search and the candidate(s) hired. Our survey received responses from staff at institutions that advertised 198 openings last year, which resulted in the hiring of 202 historians.
The good news in the responses was the relatively small number of openings that went unfilled. Unlike the response to a similar survey in 2008–09, very few of the job lines were reported as cancelled for budgetary reasons after they were posted.
The responding departments reported that almost 9 percent of their positions were not filled, but only 2.7 percent were cancelled for financial reasons (as compared to 15 percent of the openings reported two years earlier). A higher proportion of the positions that went unfilled were due to a lack of appropriate applicants (3.7 percent) or because their selected candidate(s) took another offer (another 3.2 percent).
Despite the relatively large number of searches that were not completed due to difficulties on the applicant side, the vast majority of the respondents reported they were satisfied with the applicant pool—particularly for entry-level positions. For positions hiring at the assistant professor level, 87.3 percent of the applicant pools were deemed satisfactory.
The only subject areas with notably high levels of dissatisfaction were in the fields of African, Middle Eastern, and world history, where 11 percent or more of the respondents said they were dissatisfied with the applicant pool they had to choose from.
The more worrisome finding from the survey is an increase in the number of applicants for each position. The respondents reported they received an average of 87.3 applications per position—up slightly from an average of 84.9 applicants in the 2008–09 survey—and the highest level since the worst of the job crisis in the mid-1990s.

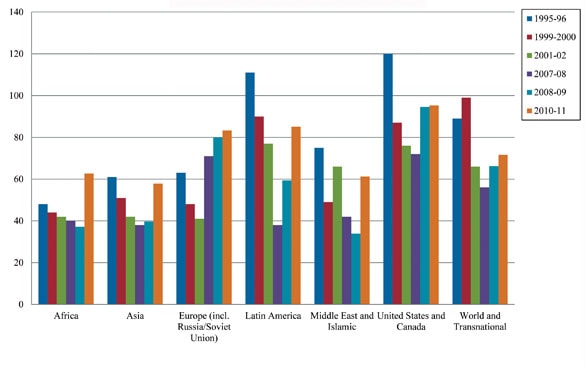
Figure 3: Average Number of Applicants per Junior Faculty Position in Geographic Areas
The jump in applications occurred across all of the major geographic fields. But what is most striking is the sharp increase in the average number of applications for positions in fields outside of European and U.S. history (Figure 3). Applications for positions in African, Latin American, and Middle East/Islamic history all increased by 25 or more in just two years. The average number of applications for African history openings, for instance, jumped from 37.2 to 62.7, while applications in Latin American history increased from 59.4 to 85.1.
Even though a much larger number of PhDs were conferred in European and U.S. history, the average number of applications increased, but much more modestly—rising from an average of 80.0 to 83.3 for European history positions, and from 94.6 to 95.3 for positions in the history of the United States.
Hiring Trends Show Expansion in Departments
The reported hirings and separations from the departments listed in the annual Directory provide better news than the trend evident in the job listings. For the first time in the past three years, the number of full-time faculty hired into departments was higher than the number leaving.
The number was still relatively modest, as 422 full-time faculty members left and 515 were hired, but it at least marks the end of a worrisome period of contraction. From 2007–08 to 2009–10, the number of full-time faculty members listed in the Directory fell by 519 (a decline of 4.8 percent after more than a decade of positive growth in the discipline).
The data from the Directory also provide some general information about the faculty entering and leaving the departments. On average, the 201 faculty leaving positions at the associate or full professor level had earned their degrees in 1984. But almost a quarter of the tenured faculty leaving their departments had earned their degrees in the past 15 years, indicating some increased movement between departments.
Conversely, the average new assistant professor earned his or her degree in 2008, reflecting the typical three-year window for a new PhD to find first employment. Two-thirds of the newly hired assistant professors earned their degrees between 2008 and 2011. Despite the general preference for recent PhDs, a few programs hired new assistant professors with degrees as far back as 1993, but these were generally the exceptions.
Looking Ahead—Doctoral Programs Still Crowded
The number of new PhDs reported to the annual Directory for the 2010–11 academic year was up a slight 3.1 percent to 912. While the increase was relatively modest—particularly when compared to a 17 percent increase two years ago—the total number of new PhDs reported to theDirectory reached the highest level since 2001–02.
While this may seem dubious at a time when the number of academic jobs is near the lowest level in 30 years, it reflects both a long-term trend and the optimism of about eight years ago when many of them first started their graduate program.
Nevertheless, our annual survey of history PhD programs shows that the number of applications to the departments actually increased over the past year—from an average of 90.5 to 116.3 per program. This is not entirely surprising, as graduate school has traditionally been a refuge in times of economic adversity, but it does clearly run against recent trends in the academic job market.
But beneath the broad average, there is an interesting disparity between the larger programs and their smaller counterparts. The largest programs saw a drop in the average number of applications to their programs—from an average of 247.7 in 2009–10 down to 216.3 reported in 2010–11. But the smaller programs saw an increase in the number of applications—up an average of slightly more than 10 per department. Since they represent a larger number of departments, they skewed up the average for all programs.
Despite the increase in the number of applications, the number of students actually matriculating into the PhD programs declined a bit from the year before—falling from an average of 9.6 per program to 8.2. The number of students entering programs fell at large, medium, and small departments, reflecting a conscious effort by programs to rebalance their numbers in light of recent trends in the job market.
But the average number of students in history PhDs is still historically very high—now averaging almost 55 students per program—basically identical to what it was when we conducted the first such survey in 2006. This indicates that the number of new PhDs that will be conferred over the next few years will remain quite elevated as the profession struggles out of its current difficulties.
Liz Townsend, the AHA’s coordinator of Job Center and professional data, assisted with data collection for this report.

