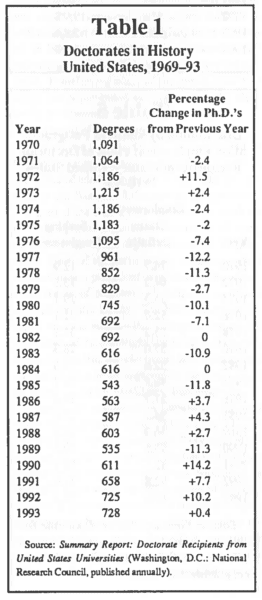
 As the accompanying tables indicate, data from the annual survey conducted by the National Research Council (NRC) charts another year of growth in the number of new Ph.D.’s awarded in history. While this constitutes the fourth consecutive year of growth after the decline reported for 1989, the level of growth is significantly lower than in the previous three years, According to the. NRC (see Table 1), 728 individuals received doctorates in history in 1993, an increase of only 0.4 percent over the number reported in 1992, compared to an average 10.3 percent annual growth over the previous three years. The fate of growth for new doctorates in the humanities overall similarly slowed from 8.4 percent in 1992 to 0.8 percent in 1993. What remains to be seen is whether the slower growth in 1993 is an aberration or the welcome beginning of a much-needed contraction of the supply side of the job market. If the supply side resumes growing at a rate comparable to that of 1990-92, then the job market will worsen, even if the number of positions open remains stable or even increases modestly—there will simply be more and more people chasing a limited number of jobs.
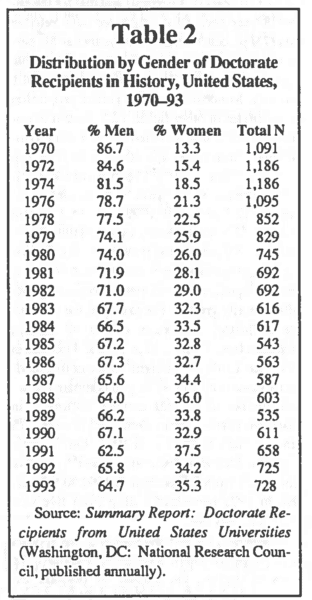 According to NRC’s demographic profile of the 1993 Ph.D. recipients, the percentage of history doctorates earned by women increased slightly to 35.3 percent, up from 34.2 percent reported for 1992 but still lower than the record high of 37.5 percent in 1991 (see Table 2). The 1993 figure is slightly above the average for the previous 10 years (34 percent) and marks the 11th straight year in which over 30 percent of the recipients of history doctorates have been women.
While the percentage of history doctorates earned by individuals from racial and ethnic minorities increased in 1993, the growth was slightly less than that reported for women—an increase of only 0.8 percent, increasing from 8.5 in 1992 to 9.3 percent in 1993 (see Table 3). It is difficult to discuss trends in this area because of the relatively small numbers involved, but the 1993 level is above both the average for the past 10 years (8.4 percent) and that for the entire 18-year period for which we have reliable data (7.9 percent). In only two years has the percentage of minority recipients reached double digits-in 1989 (10.7 percent) and 1987 (10.1 percent). Minorities earned a greater proportion of doctorates in other fields: 12.2 percent of humanities doctorates awarded in 1993 went to individuals from racial and ethnic minorities (up from 10 percent in 1992); 13 percent of socia1 science doctorates were earned by minorities (compared to 12.1 percent in 1992); and 15.3 percent of all Ph.D.’s were earned by minorities (compared to 13.9 percent the previous year).
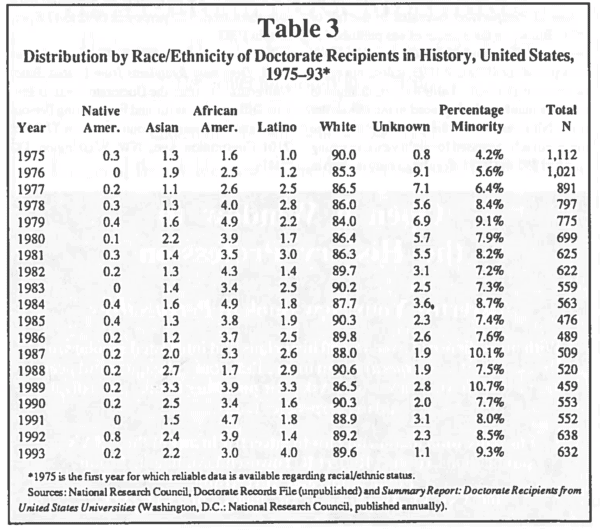 Focusing on aggregates and percentages can, however, obscure significant developments regarding specific minority groups. For example, the percentage of history doctorates earned by Latinos increased from 1.4 percent in 1992 to 4 percent in 1993 (see Table 3); the significance of that modest increase is clearer when you compare the actual number of Latinos earning doctorates in those two years—9 compared to 25 or over 2.75 times as many in 1993 as in 1992. On the other hand, the decline in doctorates earned by Native Americans from 0.8 percent in 1992 to 0.2 percent in 1993 represents a drop from five new Ph.D.’s to only one.
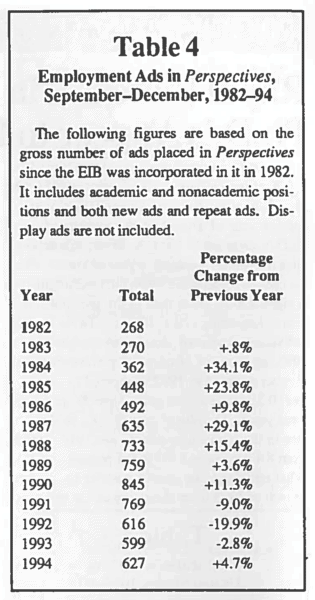 Meanwhile, the demand for historians appears to have stabilized for the moment—after three years of decline, the number of position announcements in the Employment Information section of Perspectives increased in the fall of 1994. But while the number of ads published in September-December 1994 is higher than in the same period for 1992 and 1993, it does not reach the levels of 1987-91. Table 4 charts changes in the gross number of ads placed in the newsletter in the fall months over the past 12 years. The number of ads increased for eight years, reaching a peak of 845 in 1990 before beginning to drop in 1991. While the increase for 1994 is only a modest 4.7 percent, that is a welcome change from the nearly 30 percent overall decrease over the previous three years. At the same time, the number of positions posted for interviewing at the annual meeting Job Register has dropped—down by about 18.8 percent from last year. While that is a serious decline, it is not as large as that reported last year (26.9 percent) and may not reflect a decline in the number of positions open but simply a growing preference for interviewing outside the Job Register facility.
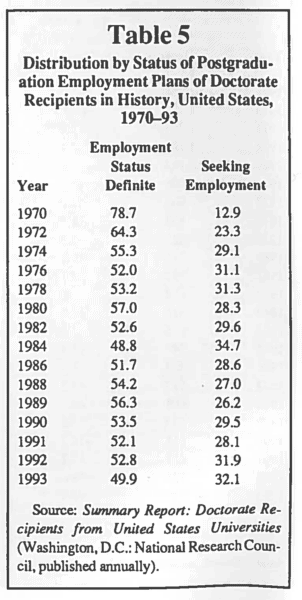 The impact of the contracting job market can be seen in Table 5, which charts the status of post graduation plans for recent doctorates. As the number of jobs advertised has declined, fewer historians have had jobs in hand upon completion of their doctorates. But while that percentage (49.9 percent in 1993) appears rather low and indeed is lower than that for all humanities doctorates (50.3 percent), it is higher than that for all doctorates (43.4 percent). Also, note that NRC data indicates that there is some gender difference regarding employment status—the percentage of female history doctorates with definite employment is higher than that of male history Ph.D.’s (53.7 percent compared to 47.8). That is a difference of 5.9 percent, a significant increase over 1992, when the difference was only 1.8 percent. The growing gap is not accounted for by any change in the percentage of women with definite plans (54 percent in 1992 compared to 53.7 in 1993); rather, the gap reflects the decline in the percentage of men with definite plans, from 52.2 percent in 1992 to 47.8 percent in 1993.
For a copy of the NRC’s Summary Report 1993: Doctorate Recipients from United States Universities, contact the Doctorate Records Project, Office of Scientific and Engineering Personnel, National Research Council. Room TJ 2006. 2101 Constitution Ave., NW, Washington, DC 20418.
