The number of new history PhDs inched upward slightly, rising from 1,024 in the 2000–01 academic year to 1,030 in 2001–02. While modest, this reverses a brief decline and marks the second-highest number of new history PhDs since 1976.
The annual survey of PhDs by the National Opinion Research Center (NORC) for five federal agencies provides the most accurate measure of history PhDs.1 The NORC numbers are higher than those reported to the AHA’s annual Directory of History Departments, Historical Organizations, and Historians, because they allow new PhDs to self-select the field of their degree. The NORC survey thus includes the dozens of American studies, area studies, and other field specialists who may not appear in the AHA directory, but compete in the history job market—and must, therefore, legitimately find a place in the computations.

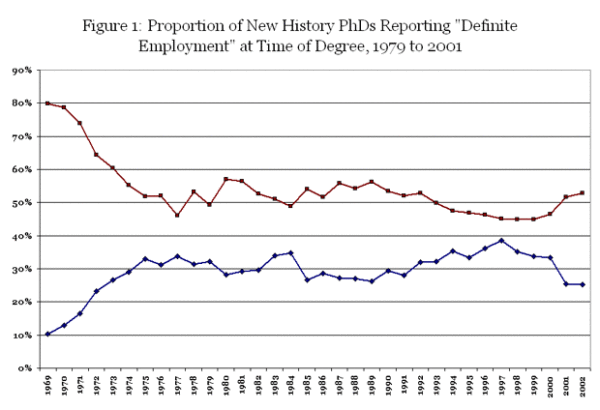
Figure 1
The NORC also reports further improvement in the hiring of new history PhDs. The report contains another positive sign, as the number of new history PhDs with “definite employment” when they received their degree rose by 2.5 percent to just under 53 percent of the new PhDs (Figure 1). This marks an increase of 18 percent from the low point reached in 1998–99.
Perhaps more importantly, the proportion reporting that they were actively seeking employment at the time they received their degrees fell to the lowest level in 30 years. Job seekers in the cohort of new PhDs fell to 25.3 percent, a decline of more than one-third since that figure topped out at 38.5 percent in the 1996–97 academic year. The gap between those with definite employment and those still seeking a job is comprised of those interested in postdoctoral study or uncertain about their future plans.
While our most recent survey of available jobs suggests broad variation in the possibilities for employment, the NORC figures do indicate some improvement in the balance between PhDs and jobs.2
Changes among the Fields
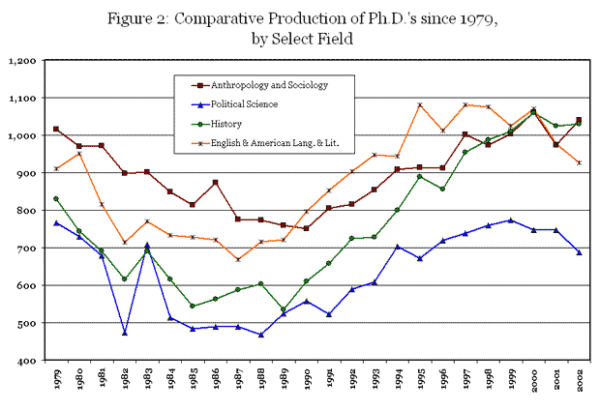
The slight increase in the number of history PhDs during 2001–02 was quite modest in comparison to the rapid growth through the 1990s, when the number of new history PhDs was growing by an average of more than 5 percent each year. But history is still outpacing many related fields (Figure 2). The number of PhDs in English and American languages and literature fell 8 percent and the number of new PhDs in political science fell 5.2 percent. Only the combined category of anthropology and sociology showed a sizeable increase of 6.9 percent.

Figure 2
Overall, the total number of doctorates conferred in all disciplines fell to its lowest point in 10 years, with 413 universities awarding 39,955 research doctorate degrees. The history discipline’s portion of the PhDs conferred reached its highest level in 20 years, comprising 2.6 percent of the degrees conferred (at its nadir in 1992–93, history comprised 1.8 percent of all PhDs). This lags behind a few larger fields like psychology, chemistry, and the combined fields of languages and literature. History has also gained relative to the other fields classified in the humanities, rising from 16.2 percent of the humanities PhDs in 1992–93 to 19.2 percent in the new survey.
Within our discipline, American history continues to be the largest field of study by a sizeable margin. Within the 2002 cohort of history specialists in American history comprised 40.9 percent of the new PhDs, off just slightly from its peak of 41.9 percent just two years before. In comparison, European history comprised 22.5 percent of the new PhDs, and 6.5 percent declared themselves in the field of Asian history.
Regrettably, these are the only three geographic categories they track, so significant portions of the world are relegated to the broad categories of “general” and “other” history, which garner 8 percent and 17.7 percent respectively. Presumably, though, some of the new PhDs in these categories could also be working in areas that touch on American, European, and Asian history—further inflating their numbers.
Demographics of the 2002 PhD Cohort
The time spent working toward the degree dipped slightly, from an average of 9.3 years registered for graduate courses to 9 years. However, the average number of years since the baccalaureate degree actually increased a bit, to 11.8 years after completing the baccalaureate degree. The average age of new history PhDs showed little change, with a median age of 34.7 years.
The age and years since the bachelor’s degree are actually lower than the average for PhDs in non-science fields, where the median time since the baccalaureate degree was 14 years, and the median age was 38.3. However, those figures are skewed significantly higher by PhDs in education, where the PhD is a vital credential for advancement after years in the classroom.
History continues to set the pace for the longest time spent registered for classes, though English and American languages increased to the same nine-year pace. But these are the only fields where new PhDs are taking so long to get their degrees.
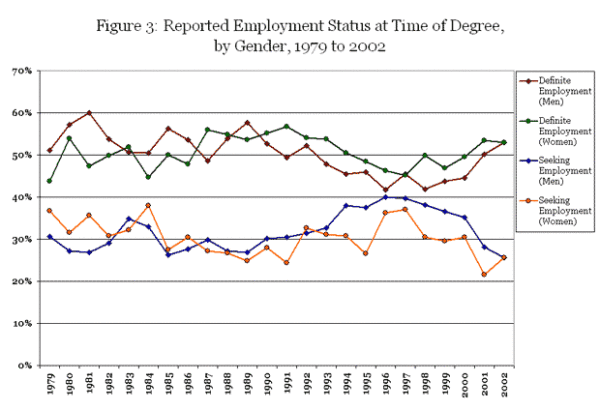
Other data on the demographics of the new PhD cohort marked some significant changes. The proportion of women among the new cohort of history PhDs fell for just the third time in the past 10 years, from 40.3 percent to 40 percent of the new degree recipients. At the same time, the recent advantage women seemingly enjoyed on the job market was erased. Over the past decade women were 5 to 10 percent more likely to report definite employment when they received their degrees, and the difference on the numbers still seeking employment was even higher. However, in 2002 the gap between men and women on both questions disappeared (Figure 3). It is clearly too early to tell what this might indicate for the changing dynamics of the job market for history PhDs.

Figure 3
Similarly, after increasing over the previous two years, the representation of minority historians among new history PhDs fell from 12.9 percent of the U.S. citizens receiving history doctorates to 12.1 percent. In real terms, 108 of the 893 U.S. citizens who received history PhDs classified themselves as members of a racial or ethnic minority.
In terms, then, of the proportion of women and minorities receiving PhDs (40 percent and 12.1 percent, respectively), history lags well behind the other fields. Minorities received 19 percent of all the PhDs conferred in 2001–02, and women received 51 percent of all new PhDs. The disparities are even more pronounced when compared to other humanities and social science fields. Women received 50.4 percent of the doctorates in humanities fields (which includes history) and 55.2 percent of degrees conferred in the social sciences. Similarly, minorities comprised 14.4 percent of the new PhDs in the humanities and 19.1 percent of the social sciences.
General Data on Financing the Degree
Lastly, the NORC report provides useful—albeit less precise—data on the economic burdens taken on by doctoral students. At the time the PhD was received, the average humanities PhD had a debt of $10,893 related to graduate studies (and was still carrying $3,954 in debt related to undergraduate studies). Just 40 percent of the new humanities PhDs finished their degrees without any school-related debts, while 29 percent finished with debts of more than $25,000. If all fields are considered, nearly half of the new PhDs (49.5 percent) finished without any debts, and 23 percent left with debts over $25,000.
Aside from loans, an exceptionally large number of the new humanities doctorate students drew on teaching assistantships as a means of financing their degree. In this new cohort, 80.2 percent of men and 82.3 percent of women reported holding a teaching assistantship at some point in their studies. Almost 74 percent of humanities PhDs reported that some portion of their studies was paid for by fellowships or scholarships.
The report highlights the correlation between a student’s family background and the economic burdens of the PhD. They show that among new humanities PhDs those who came from families in which neither parent had earned the bachelor’s degree, 37.4 percent had to rely on their own resources as their sole means of support. This compares to 30.4 percent of those from families in which both parents had degrees.
Perhaps not surprisingly then, the debt burden on those without such family support was significantly higher—27.4 percent of the new humanities PhDs whose parents don’t have a baccalaureate degree reported a debt load of more than $30,000, as compared to just 20.2 percent of those from two-degree families.
This also carries over into the amount of time taken to get the PhD degree—though whether this is due to the need to scrape together a living, different study habits, or other factors is unclear. New humanities PhDs from families without bachelor’s degrees spent an average of 9.4 years earning their degree, an average that is almost a full year longer than those from two-degree families, who took 8.5 years.
Notes
- Thomas B. Hoffer, et al., Doctorate Recipients from United States Universities: Summary Report 2002 (Chicago: National Opinion Research Center, 2003). [↩]
- See Robert B. Townsend, “History Jobs Take a Tumble, but the Number of New PhDs Also Falls,” Perspectives (December 2003), 7. [↩]

