Recent surveys of academic salaries show two clear trends for the history profession: faculty in the upper ranks continue to match or exceed rises in the cost of living, while new and junior faculty fall further behind. A separate survey of patterns of specialization among new Ph.D.’s and job openings indicates significant disparities in the “fit” between new candidates and new job openings.
Just-released studies by the College and University Personnel Association (CUPA) found that during the 1994-95 academic year, the average salary for historians at private colleges and universities rose to $47,120-a 3.9 percent increase over last year. The average salary for historians at public institutions saw a more modest 2.7 percent increase to $47,646.1 When set against a 2.7 percent increase in the cost of living, these increases reflect the second consecutive year that salaries in the historical profession have kept pace with inflation.
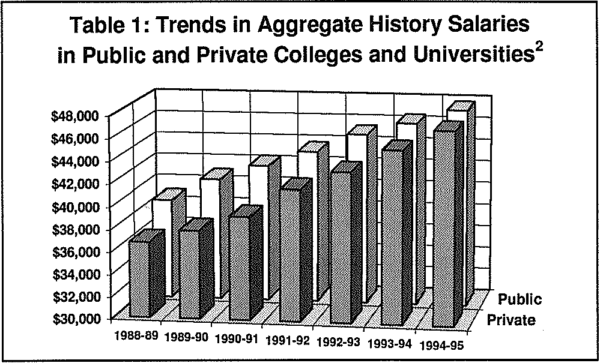
Table 1
According to the CUPA survey, the salary increases for history faculty at private institutions actually exceeded raises for faculty in all fields, which rose only 3.4 percent The 2.7 percent raises for history faculty in public colleges and universities mirrored the increases for their colleagues in the other disciplines.
One of the more interesting trends in academic history salaries over the past five years is a narrowing of the gap between private and public levels of compensation (see Table 1).2 As recently as 1990-91, average compensation for historians at public colleges and universities was $3,016 more than at private institutions. However, that disparity diminished to just $75 in 1994-95.
A much wider survey of salaries by the American Association of University Professors (AAUP) found the same positive trend in overall faculty salaries, except that the AAUP found a slight advantage in salary increases at public institutions. Unlike the CUPA survey, the AAUP report does not provide discipline-specific information but does take into account all forms of compensation. The AAUP notes that this is the first time since the mid-1980s that faculty saw two consecutive years of “real” compensation increases and characterizes this as “a ray of sunshine” after years of constriction in faculty salaries.
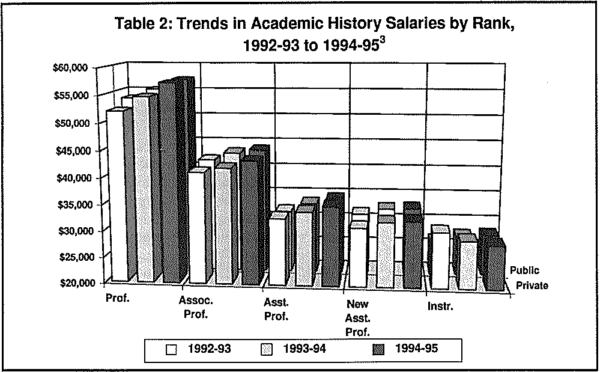
Table 2
However, optimism about aggregate salary increases should be tempered by significant disparities in salary adjustments between the ranks, as Table 2 demonstrates.3 According to CUPA, full professors comprise the largest portion of the history profession (48.1 percent of department faculty in public colleges and universities, and 44.5 percent in private institutions) and enjoyed the largest salary adjustments. Full professors in history departments in private institutions received 4.7 percent salary increases, while their counterparts in public institutions saw a 3.5 percent raise.
By contrast, the small but growing number of history faculty at the bottom ranks generally saw salary adjustments below the inflation rate, and at one level saw a real decline in wages. Instructors in private colleges and universities saw a 2.5 percent decrease in salary, which followed a 5.1 percent decrease last year. History instructors in public institutions saw a meager 1 percent increase in salary over the year before. Salaries for new assistant professors also inched forward while falling behind in real terms. At private colleges and universities, new faculty salaries rose by 0.8 percent; at the public institutions they saw only a 0.5 percent increase.
The authors of the AAUP report note a similar trend in the aggregate increases, and attribute this disparity to the advantages of faculty with a longer relationship with their institutions. According to the AAUP figures, faculty with two consecutive years at an institution (regardless of rank) enjoyed an additional 1.2 percent salary increase over colleagues who had just joined the faculty.
The effect of these disparities in the ranks falls most heavily on women. The AAUP survey found that female faculty members continue to earn significantly less than their male counterparts, whether at the professor level (where they earn $7,400 less on average) or at the lecturer level (where the average difference is $3,750). And although there are no data that quantify salary disparities for women in the historical profession, data from the AHA’s annual survey of departments support evidence from the AAUP that shows women hold a much higher proportion of part-time and lower rank positions, and hence are more likely to be affected by disparities between the ranks.4
Job Market Shows Modest Improvement, but…
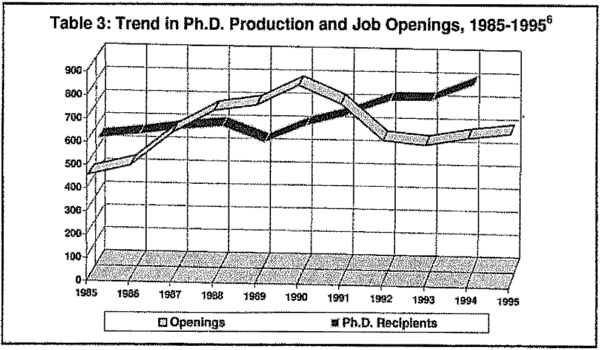
Table 3
In spite of the recent weakness in salaries for new and junior faculty members, the academic job market showed some slight improvement in 1995. For the second year, the number of employment advertisements in Perspectives rose during the crucial fall month.” when most tenure-track positions are offered. As Table 3 shows, the gross number of employment advertisements in history rose to 652 from a recent low of 599 in 1993.5
However, growth in the production of new Ph.D.’s continues to outpace the increase in new jobs. The number of Ph.D. recipients rose to 800 in 1994, according to the most recent study by the National Research Council (NRC).6 At the same time, the fit between candidates and openings makes this situation even more problematic than it appears on the surface. The Association’s most recent survey of patterns of specialization among new Ph.D.’s and job openings is not terribly promising for large number of prospective job candidates.
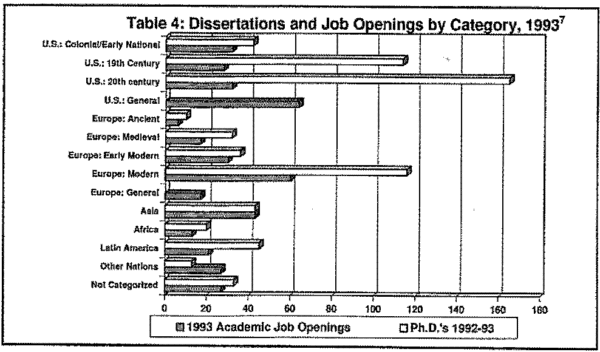
Table 4
Using the taxonomy of specializations developed by Susan Socolow, former vice president for the AHA’s Professional Division (see “Assessing Trends in the Job Market,” Perspectives, May/June 1993), AHA staff undertook a detailed study of Ph.D. recipients from the 1992-93 academic year using dissertations listed in the 1993-94 Directory of History Departments. These results were then placed alongside a detailed survey of instructor and assistant professor level job openings listed in Perspectives from September to December 1993. As Table 4 indicates, the evidence from these surveys shows that while the large number of openings are in modern European and most periods of US. history, the number of new Ph.D.’s in these fields is vastly outpacing the number of new jobs.7 This is particularly evident when supply and demand for openings in Europe and the United States is compared to that for other areas.
The largest segment of history Ph.D.’s in 1993 went to candidates working in 20th-century US. history, with 165 dissertations—24 percent of the total number listed. Even setting aside degree recipients who did not choose academic careers or seek employment in United States, in the remaining number of newly minted Ph.D.’s were pursuing a mere 32 openings. Using the NRC survey of 1993 degree recipients, the number of job candidates could be reduced by 5 percent for students with temporary visas, and another 22 percent for those who said they would seek employment outside the academy.8 This still leaves approximately 120 candidates for every 32 openings, for a ratio of almost 4 new potential candidates for every opening in the field.
These results correspond closely to the findings reported in “Assessing Trends in the Job Market” (Perspectives, May/June 1993), which covered the years 1990 to 1992. However, the neither of findings could incorporate comparative information on a large number of openings that lacked a specific time period. Collected under the “U.S. General” category are many openings for specialists in African American, women’s, and legal history. Nevertheless, as those who have attended the annual AHA Job Register can report, an estimate number of potential applicant could be significantly increased by including those degree recipients from previous years and those anticipating completion by the fall. These disparities are only slightly better for specializing in 19th-century U.S. history and modern European history.
In contrast, there were only 43 dissertations in the broad category of Asian history, set against 47 openings in 1993. Similarly, the ratios of new specialists to the number of openings in colonial United States, premodern Europe, and the history of non-Western nations is much closer to parity.
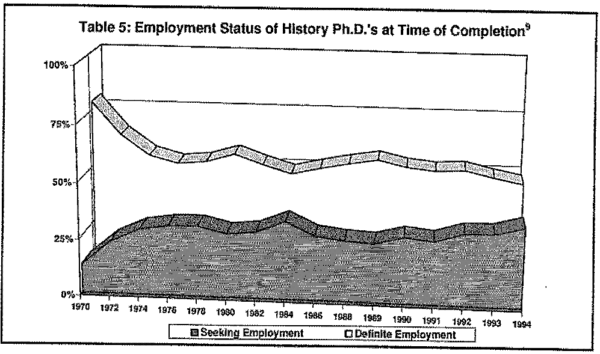
Table 5
These patterns help explain the NRC survey of 1993 Ph.D. recipients, which found that only 49.9 percent had “definite” employment prospects when they received their degree. 111is was the lowest result in 12 years for the NRC survey (see Table 5).9 A separate survey by AHA staff found that only 18.2 percent of the 1993 history Ph.D. recipients are currently employed in the colleges and universities listed in the 1995-96 Directory of History Departments.
A survey of future Ph.D. candidates offers little prospect of change in these patterns of specialization. A survey of dissertations in progress in the 1995-96 Directory of History Departments, found that 24.5 percent of those working toward Ph.D.’s are working in 20th century U.S. history. Another 17.3 percent are working in modern European history. Almost one-third of the Ph.D.-granting departments do not supply lists of dissertations in progress, so there is no way to provide a firm estimate on the number of Ph.D. candidates; there could be some variation in the exact ratios. Nevertheless, the overall pattern appears to be consistent.
Although it is hoped that this study can assist graduate students and their advisers in assessing the current job market, its limitations should be noted. This study cannot predict patterns in the job market next year, or five years from now. Also, we have no way of accounting for openings that were not advertised (contrary to professional standards), or openings that were advertised but subsequently canceled for budgetary or institutional reasons. And we cannot calculate the number of candidates on the academic job market who received their Ph.D.’s in previous years but who have been “underemployed” in part-time positions, employed outside the academy, or seeking a change of position.
There is, however, some room for cautious optimism. The demand for history instructors should increase because of a recent significant increase in the number of undergraduate and master’s level students studying history. More students received history degrees in 1993 (27,774 students obtained bachelor’s degrees and 2,952 students received master’s degrees) than in any year since 1976. These numbers reflect a sharp increase from the low point, which occurred in when only 16,048 bachelor’s degrees and 1,921 master’s degrees were conferred.10 However, the pattern in course offerings appears to be following the pattern in job creation. According to the latest AHA survey of history departments, U.S. and European history courses are still prevalent, making up 35 and 31 percent of total courses offered respectively. But this represents a significant decline from the first AHA survey, which was done in 1989, when U.S. and European history courses accounted for well over 80 percent of the total courses available.
The Association is exploring ways to improve tracking of history Ph.D. recipients and job openings in the coming years as a means to provide more firm information about the careers of degree recipient. And a biennial report by the NRC tracking the cohort of history Ph.D.’s will be released later this year and should offer a clearer picture.
Finally, a new AHA graduate student task force, established to consider the concerns of graduate students, held its first meeting at the Association’s annual meeting in January 1996. An essential part of the task force’s mandate will be consideration of how to address the problems faced by recent and future Ph.D. graduates.
Notes
- For more information, consult CUPA’s 1994-95National Faculty Salary Survey by Discipline and Rank in Private Colleges and Universities and its National Faculty Salary Survey by Discipline and Rank in Public Colleges and Universities (1995). Also see “Ray of Sunshine? The Annual Report on the Economic Status of the Profession, 1994-95” in the March-April issue of the AAUP magazine, Academe. Special studies and tabulations can be obtained through the CUPA and the AAUP. Contact the AAUP at 1012 14th St., N.W., Ste. 500, Washington, DC 20005, (202) 737-5900, and CUPA at 1233 20th St., N.W., Ste. 301, Washington, DC 20036, (202) 429-0311. [↩]
- Sources: CUPA, National Faculty Salary Survey by Discipline and Rank in Private Colleges and Universities (1992-93, 1993-94, and 1994-95) and CUPA, National Faculty Salary Survey by Discipline and Rank in Public Colleges and Universities (1992-93, 1993-94, and 1994-95). Salary figures are based on a nine- or ten-month academic year, full-time faculty only. Fringe benefits and summer earnings are excluded. [↩]
- Ibid. [↩]
- “AHA Data Shows Increased Use of Part-Time Faculty,” Perspectives, May/June 1995, 13, and “Ray of Sunshine,” Academe, March-April 1995, 19. [↩]
- Job openings calculated from gross number of employment advertisements listed in Perspectives Employment Information section from September to December, when most non-tenure-track openings are listed. Ph.D. figures calculated by the NRC in its annual Summary Report: Doctorate Recipients from United States Universities. [↩]
- R. O. Simmons and D. H. Thurgood, [Annual NRC] Summary Report 1994: Doctorate Recipients from United States Universities (1996). [↩]
- Job openings calculated using only positions accepting applicants for the instructor or assistant professor level are counted. Data collected from Perspectives Employment Information section, September to December 1993. Data taxonomy designed by Susan Socolow (Emory Univ.). See Socolow, “Assessing Trends in the Job Market,” Perspectives, May/June 1993. Ph.D. recipients tabulated from dissertation titles submitted to the Directory of History Departments and Organizations, 1993-94, supplemented by supporting data from Doctoral Dissertations in Progress, vols. 17 and 18. [↩]
- H. Thurgood and J.E. Clarke, [Annual NRC] Summary Report 1993: Doctorate Recipients from United States Universities (1995). [↩]
- Source: [Annual NRC] Summary Report: Doctorate Recipients from United States Universities (1972-96). [↩]
- Source: U.S. Department of Education, Center of Education Statistics. [↩]


