Figure 1
The production of history PhDs hit a 20-year high in 1998 with 988 doctorates conferred, according to the latest federal survey. As one might expect, this was accompanied by a further decline in the number of new PhDs reporting “definite employment” at the time they received their degree. However, on the positive side, the representation of women and minorities in the new cohort posted small gains.
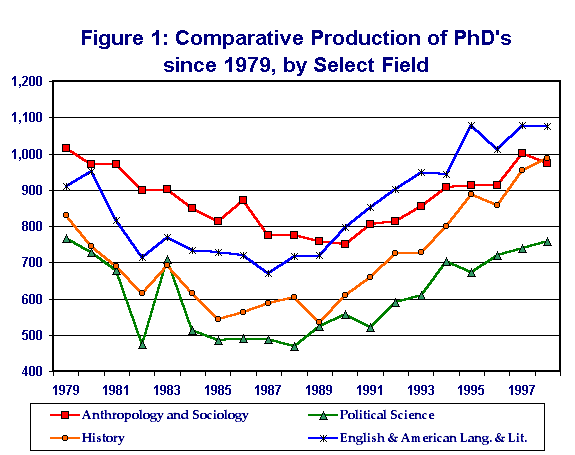
History was one of the few disciplines to post an increase in the number of PhDs in 1998, according to data collected for five federal agencies by the National Opinion Research Center (NORC). Overall PhD production dipped slightly, from 42,705 produced in all disciplines during 1997 to 42,683 in 1998.1 Moreover, every other humanities and social science discipline in the survey—with the exception of political science—reported a decline in number of PhDs produced (Figure 1).

Figure 2
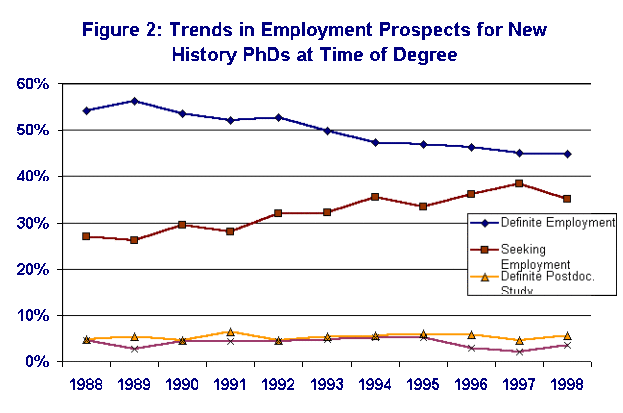
For the 10th year in a row the proportion of new history PhDs reporting “definite employment” at the time of degree declined, albeit slightly, from 45.1 to 44.9 percent (see Figure 2). At the same time, the number of those still “seeking” employment when they received the degree fell from 38.5 percent in 1997 to 35.1 percent last year. However, the difference was due to a significant increase in the number of history PhD recipients pursuing postdoctoral studies instead of immediate employment, rising from 6.7 percent in 1997 to 9.2 percent in 1998.
The proportion of women among new history doctorates rose slightly, from 37.1 percent in 1997 to 39 percent in 1998; however, this remains below the high point of 41.3 percent achieved in 1996. In 1998, 49.9 percent of women reported definite employment at the time they received their degrees, compared to 41.8 percent of their male counterparts.
Similarly, 38.1 percent of the male PhDs were still seeking employment while 30.4 percent of women reported they were still on the job market.
The representation of minority historians among the new cohort of PhDs rose to the highest point in the survey’s 22 years, constituting 11.8 percent of the U.S. citizens receiving history doctorates—up from 11.4 percent the year before.

Figure 3
History PhD recipients in 1998 spent more time working toward the degree than almost any other cohort of PhDs. The average history PhD received his or her degree 11.5 years after completing the baccalaureate degree, which included an average of 8.6 years registered as students in graduate programs. This was down only slightly from the year before. This helps explain why history PhDs are among the oldest at the time of receiving the degree, averaging 34.8 years of age (compared to a median age of 33.7 years for all disciplines).
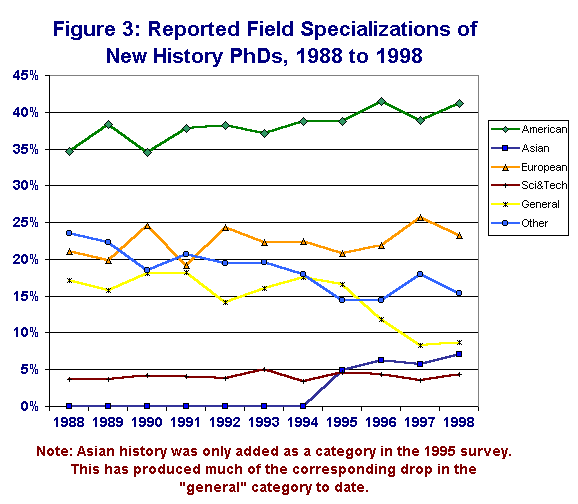
Not surprisingly, most of the new history PhDs in 1998 reported they specialized in American history. Specialists in American history accounted for 41.2 percent of the new history PhDs produced, compared to 38.9 percent the year before (Figure 3). Those specializing in Asian history also increased, from 5.7 percent in 1997 to 7.1 percent in 1998. The proportion working in European history dipped slightly between 1997 and 1998 (from 25.7 to 23.3 percent).
Note
- NSF/NIH/NEH/USED/USDA, Survey of Earned Doctorates, Prepublication Tables for the Summary Report 1998 Doctorate Recipients from United States Universities, November 1999. In 1997, NORC took over data collection from the National Research Council, which had conducted the survey since 1977. The data was released considerably earlier than usual this year, and hence the Association has no new data from the Directory of History Departments for comparative purposes. For more on the latter see Robert B. Townsend, “Sharp Increase in Number of History PhDs Awarded in 1997,” Perspectives (October 1999): 3. [↩]

