After lagging behind other disciplines for almost a decade, history departments finally seem to be gaining ground in the number of undergraduate students earning degrees, even as the number of students earning graduate degrees in the field continues to decline.
The Department of Education reports 29,808 baccalaureate degrees conferred in history during the 2003–04 academic year—a 7.5 percent increase over the year before. This was almost double the growth reported for bachelor’s degrees conferred in all fields, which rose by a modest 3.8 percent.1

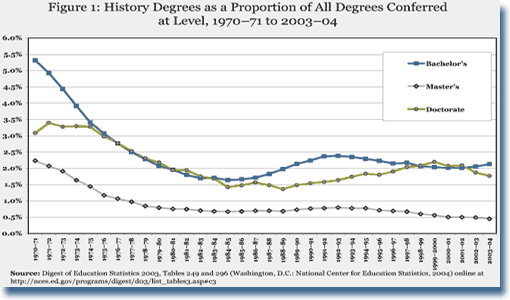
Figure 1
As a result, history degrees comprised 2.13 percent of the 911 degrees conferred. This marks a modest improvement from the recent low of just 2.01 percent of all degrees conferred, two years earlier (Figure 1).
In contrast to the rising number of undergraduates, the number of graduate degrees in history fell—if ever so slightly—over the same span. The number of new history master’s degrees fell from 2,525 to 2,522 in the 2003–04 academic year, while the number of new doctorates conferred in history fell from 861 to 855.
These modest declines occurred when the number of graduate degrees conferred in all fields was actually rising fairly rapidly. Among all disciplines, the number of master’s degrees increased by 9.0 percent from the year before, and the number of doctorates rose 5.1 percent. As a result, in the 2003–04 academic year, history comprised just 0.45 percent of all master’s degrees conferred (down from 0.49 percent) and 1.77 percent of all the doctorates conferred that year (down from 1.87 percent).
Boom Times in the Number of New History Majors

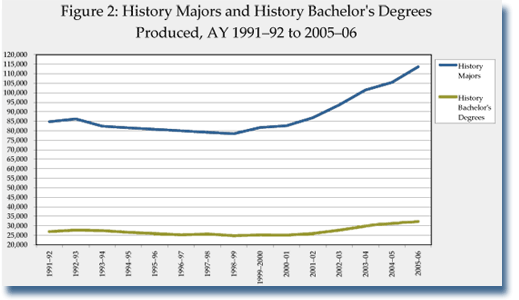
Figure 2
More recent data compiled for the new (2006–07)Directory of History Departments and Organizations provides further cause for optimism about the trends in the number of undergraduate history students, as the number of history majors and undergraduate degrees continued a fairly steady ascent (Figure 2).2 The 564 departments that have been listed regularly in the Directory over the past 15 years reported 113,623 majors in the 2005–06 academic year. That represents a 7.8 percent increase over the year before, and a 41 percent increase over the number reported 10 years earlier.
By almost any measure, this growth seems to extend quite widely. Just a decade ago, the average U.S. history department listed in the Directory reported 149 undergraduate students majoring in history. In the most recent Directory that average had grown to 202 students per department. And this pace has accelerated recently. Among the regular listers in the Directory, the number of history majors increased by one-third over the past five years.
Regardless of whether we classify the departments by the size of the department, type of institution, or region of the country, history departments reported double-digit growth in the number of majors over the past five years. At large departments (those averaging more than 250 majors) the growth rate has been a bit slower—averaging just 25 percent, while growth at small departments (those with less than 80 majors) tended to be faster than average, rising almost 41 percent. Very small departments (those with less than 50 students five years ago) have almost doubled in size.
Public comprehensive and baccalaureate universities led the recent growth, as the number of majors increased by 44 percent over the past five years at both types of institutions. Only the private liberal arts colleges seemed to lag noticeably, but they still reported an average of 17 percent more majors in their departments.
Not surprisingly, the institutions conferring the largest number of undergraduate history degrees are the large public universities, particularly those with doctoral programs. The history department at UCLA has consistently been the largest source of new history undergraduates for the past three decades. Over the past 10 years, for example, the department has conferred almost 200 more baccalaureate degrees than the next closest department. According to its most recent report, UCLA conferred 466 bachelor’s degrees in the 2003–04 academic year, while the department at the University of Texas at Austin came in a distant second, reporting 286 degrees conferred.
In comparison, the average number of degrees from private and liberal arts institutions is much smaller. For instance, the College of Holy Cross, which conferred the largest number of history degrees among liberal arts colleges, reported only 75 new baccalaureate degrees.
It is important to see these increases within the larger context of higher education. According to Department of Education researchers, America’s colleges and universities have been enjoying a surfeit of new students in recent years because of the growing wave of 18- to 24-year-olds in the general population. This demographic wave is projected to continue to grow at least through 2015.3
In the early part of the decade this wave created a troubling anomaly for history departments. On the one hand, the number of history majors was growing and history departments reported they were struggling to teach an ever-larger number of students in their classrooms. At the same time, however, history was losing ground in the proportion of undergraduate students receiving degrees at colleges and universities, which undercut departments’ pleas for additional faculty and staff.
We can only hope that as history departments attract and teach a growing portion of the student population, they will be able to exert greater influence on administrations to secure a commensurate increase in faculty and support staff.
Contrasting Declines in Graduate Degrees
Given that the number of students earning history degrees at the undergraduate level has been on the rise for the past five years, it seems surprising that the number of graduate-level degrees continues to decline.
In part the declines seem tied to a change in the mix of schools conferring master’s degrees in the discipline. Only 4 of the 10 schools that conferred the largest number of MAs in history 10 years ago are still among the top 10 in the most recent report, as the number of MAs conferred by large PhD programs like those at Columbia University, Indiana University, University of California at Berkeley, and University of Wisconsin at Madison declined by 20 to 40 percent. Whether this decline in the number of history MAs is tied to the reduction in the number of new PhDs at those schools or to a change in the path toward the PhD is unclear.
In contrast, most of the programs now conferring the largest number of history master’s degrees lack PhD programs or have comparatively small programs. George Mason University has conferred the largest number of master’s degrees in the field over the past 10 years, averaging 34 new MAs per year over the most recent five-year span. Other programs moving near the top of the list include Providence College, Villanova University, San Francisco State University, and SUNY Albany.

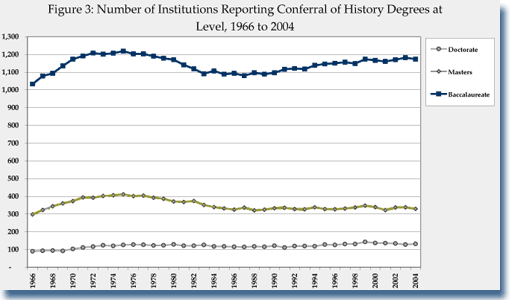
Figure 3
Looking more broadly at all the schools conferring history master’s degrees, there is a notable change in the number of institutions conferring those degrees and a marked change in the regional distribution of those programs. The number of schools conferring history master’s degrees has declined significantly over the past 30 years. The number was highest in the 1973–74 academic year, when 411 schools were conferring history MA degrees (Figure 3). In 2003–04, only 329 institutions reported conferring the degree. At the same time, the average number of degrees being conferred by each school has fallen from an average of 11.1 degrees per year, to just 7.6 per year.
At the same time, the regional mix of programs conferring the degree has shifted south and west. In 1974, 45 percent of the history master’s degrees were conferred in the mid-Atlantic and Great Plains states (particularly in New York, Wisconsin, and Illinois). In the most recent report, that had fallen to 36 percent of the total. Over the same span, the portion of degrees conferred by programs in the Southeast and Far West increased from 28 percent to 35 percent.
The distribution of programs conferring history PhDs has been comparatively stable. UCLA has conferred the largest number of PhDs over the past 10 years, with an average of almost 31 new doctorates per year. The department at Columbia University awarded the second highest number, with an average of 26 history PhDs conferred in each of the past 10 years.
Overall, however, the number of institutions reporting new history doctorates has declined slightly over the past five years, from a peak of 143 in the 1999–2000 academic year to 132 in the 2003–04 academic year. It should be noted, however, that the number of institutions creating new history PhD programs is growing. The 2006–07 Directory, which is currently in press, lists 157 U.S. institutions with active PhD programs—an increase of 12 over the course of a decade.
Given the concerns about the academic job market in the late 1990s and into the current decade, it is not surprising that the average number of history PhDs conferred annually is declining. The average reached its lowest point in 1985, at just 4 doctorates per year, before rising to a peak of 7.1 per year between 1998 and 2000. This dropped to an average of just 6.4 new PhDs per institution in the most recent report.
It remains to be seen whether the reported increase in the number of undergraduate history majors will stem, or even reverse, the decline in the numbers of history PhDs completed each year. However, because it takes, on average, more than nine years (after obtaining the bachelor’s degree) to get the PhD, it is difficult to determine the end results with any degree of certainty.
Notes
- The information on new degrees is contained in The National Center for Education Statistics Digest of Education Statistics, 2005 available online at https://nces.ed.gov/programs/digest/d05/lt3.asp#19. Institution-level data drawn from the National Science Foundation’s WebCaspar system at https://caspar.nsf.gov. The WebCaspar system provides tabulations of data at the department and disciplinary level. For the analysis in this article, data tables from the WebCaspar system were merged with demographic data from the Department of Education’s National Center of Education Statistics IPEDS Dataset Cutting Tool (hd2002) available at https://nces.ed.gov/ipedspas/dct/index.asp and the 2006 Carnegie Foundation for the Advancement of Teaching classifications available at https://www.carnegiefoundation.org/classifications/index.asp?key=809. Since data for 1999 was not reported, values were estimated by averaging the number of degrees reported in 1998 and 2000. [↩]
- While the Directory has barely half the number of schools reported by the DoE as conferring baccalaureate degrees in history, the 564 departments that we track as regular listers in the Directory reported conferring 90.1 percent of the BAs reported to the Department of Education in the 2003–04 academic year. [↩]
- William J. Hussar, Projections of Education Statistics to 2015 (Washington, D.C.: National Center for Education Statistics, 2006). [↩]

