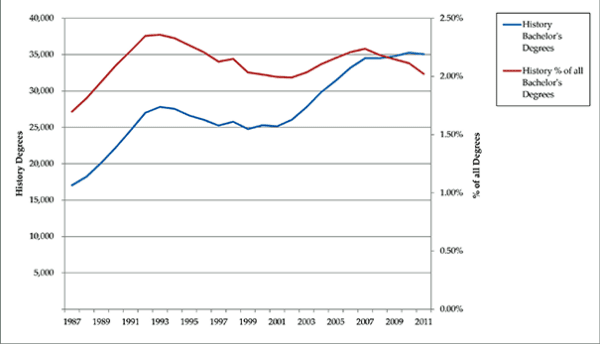
During the 2010–11 academic year, the number of undergraduate students earning degrees in history dropped—albeit by a small percentage—for the first time in a decade, even as the number of students earning degrees in all fields continued to rise. As a result, the history discipline’s share of degrees earned in 2011 declined to the lowest level in 10 years (fig. 1).

Figure 1: History Bachelor’s Degrees Conferred and History as Percentage of All Bachelor’s Degrees, 1987-2011
According to new information from the Department of Education, history programs conferred 35,059 bachelor’s degrees in the discipline, and another 3,588 students earned degrees with history as their second major. Together, 0.6 percent fewer students earned history degrees this year compared to last.1
Even with the decline, the number of students earning degrees in the discipline remained exceptionally high. The discipline broke the 35,000 mark in degrees conferred for first time on record last year, and remains above that mark. But this occurs at a time when an unprecedented number of undergraduate students are earning degrees in other fields, so history’s portion of the student population fell for the fourth year in a row. History accounted for 2.24 percent of the degrees conferred in 2007, but only 2.02 percent in 2011, which is lower than all but five of the past 25 years.
The difference between 2.24 percent and 2.02 percent may seem tiny, but it means a loss of 3,700 students. And these numbers play a vital role in the employment picture for the discipline.
The increase in the number and proportion of undergraduate students majoring in history (and more generally taking history courses) supported a significant increase in hiring in the decade leading up to the crash of 2007. As a result, any signs of a slowdown in this area should be viewed with concern.
The decline in history as a portion of all undergraduate degrees corresponds to a larger drop for the humanities as a whole over the previous five years. In 2007, the humanities conferred 7.5 percent of the degrees, but in 2011 awarded only 6.7 percent.
The life sciences is the fastest growing field of study—rising from 10.6 percent of the degrees conferred as recently as 2004 to 14.9 percent of the undergraduate degrees in 2011. The social sciences also experienced a small increase, growing 10.0 to 10.2 percent of the degrees from 2010 to 2011.
The business field currently awards the largest number of degrees—conferring 21.1 percent of the undergraduate degrees in 2011. The share of bachelor’s degrees going to business students has been declining recently (from a high of 22.3 percent of the degrees in 2004).
Where the Degrees Came From
Currently, programs at research universities confer the largest proportion of history degrees, led by the department at UCLA, which conferred 472 bachelor’s degrees in 2011. The next largest program, the University of Texas, conferred 286 degrees.
The large programs are not normative, however. Of the 1,213 institutions that conferred history degrees in the 2010–11 academic year, 813 conferred 25 or fewer degrees, as compared to just 79 conferring more than 100 degrees
One of the deeper underlying trends that emerges from the data is the growth in the proportion of degrees conferred at institutions classified as master’s level colleges and universities by the Carnegie Foundation for the Advancement of Teaching. As recently as 1990, programs identified as master’s institutions awarded less than a quarter of the undergraduate degrees in the discipline. In 2011, they conferred one-third of the new undergraduate history degrees. This trend marks an important shift, as history has traditionally been popular at research universities and liberal arts colleges.
Schools in the California state system showed particularly strong growth over that span, more than doubling from 500 to 1,154 degrees conferred.
Demographics of History Students
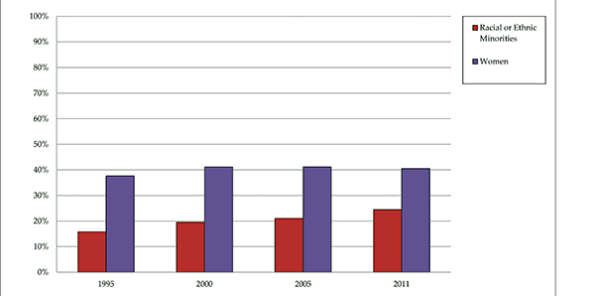
The demographics of the students who earned history degrees also showed some signs of change over the past 16 years—though seemingly moving in different directions (fig. 2). Among the new history degree recipients in 2011, 24.5 percent were identified as racial or ethnic minorities, which is up from 15.8 percent of the degree recipients in 1995.

Figure 2: Percentage of Undergraduate Degrees in History Earned by Women and Minorities, 1995-2011
A significant amount of the change resulted from rising numbers of Hispanic and Latino students. In 1995, 4.4 percent of the new degree recipients were identified as Hispanic or Latino. That number grew to 7.9 percent in 2011. This change has occurred in all regions of the country, but particularly in the West and Southwest.
In comparison, the representation of African Americans actually fell a bit—from 5.4 percent of the history degree recipients in 2000 to 4.4 percent in the most recent year.
The representation of women among new history degree recipients has been comparatively flat, with a slight decline over the past two years, from 40.7 percent in 2010 to 40.5 percent in 2011. The proportion of women earning undergraduate history degrees peaked in 2005 at 41.2 percent, and has been flat or declining ever since.
The demographics of students taking Advanced Placement history tests over the past decade provide a useful point of comparison. In 2012, 54 percent of the AP history test-takers in the class of 2012 were women, and 42 percent were identified as members of a racial or ethnic minority.
The gap between the range of students showing an advanced interest in history at the high school level (or at least an advanced interest in avoiding further history study at the college level) and the demographics of the students who major in history, highlights the challenges for the discipline. The discipline’s inability to appeal to a diverse student population is a further drag on student numbers, and by extension, on the ability to claim additional faculty lines for teaching.
Note
- Information on new degrees is gathered in the Integrated Postsecondary Education Data System (IPEDS) conducted by the Department of Education’s National Center for Education Statistics, and made available for tabulation and analysis through the National Science Foundation’s WebCaspar system. [↩]

