In the February 1988 Perspectives, Washington Notes reported on the steady growth in AHA membership since 1984, the dramatic increase in attendance at the 1987 annual meeting, and evidence of expansion in the job market—all indicating that the discipline may finally be reviving from the slump of the 1970s and early 1980s. The most recent data from the National Research Council and the Department of Education support that optimistic conclusion. They report that, for the first time in over a decade, the number of degrees awarded in history increased at all levels.
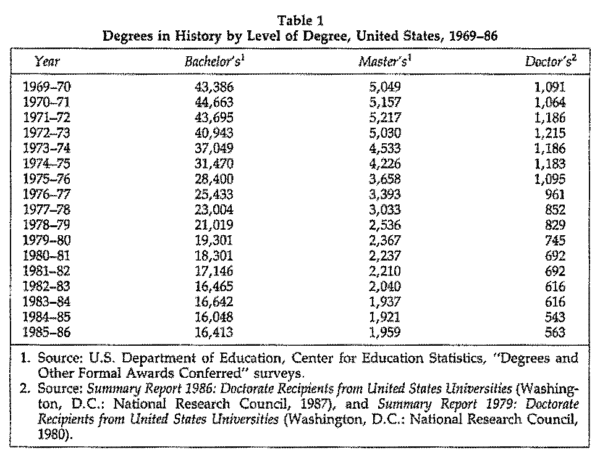
According to the NRC’s Summary Report 1986: Doctorate Recipients from United States Universities, the total number of doctorates awarded in the United States in 1985–86 was 1.8 percent above the 1984–85 level, a small increase but still the widest variance in a decade. The 1985–86 cohort was the largest in ten years. In the humanities, the increase was more modest, only .9 percent, but the number of new PhDs in history rose by 3.7 percent, the first increase since the peak year 1972–73. While that increase is significant, the discipline is far from recovering from its losses. Indeed even with the 3.7 percent increase, the annual output of new PhDs in history remains 53.7 percent below the 1973 peak level. While all the humanities experienced a decline (36 percent overall) over the past decade and a half, the drop in the number of new history doctorates was the greatest, exceeding even that experienced in foreign languages and literature, English and American languages and literature, and philosophy.
Still, we have reason for optimism, particularly when the data for history doctorates is linked with comparable data on BA and MA degrees. Table 1 charts the decline in degrees awarded over the last decade and a half. The number of Bachelor’s degrees awarded in history peaked in 1970–71 at 44,663, declining through the next decade and a half except for a brief upturn in 1983–84. We cannot yet say with certainty whether the 2.3 percent increase in 1985–86 is only another aberration or the beginning of a new trend, but comparable increases for the first time in the other two categories support an optimistic interpretation. For Master’s degrees, the peak year was 1971–72, followed by a steady decline until a modest 2 percent increase in 1985–86. The number of new doctorates in history peaked a year later in 1972–73, followed by a comparable period of decline ending with a 3.7 percent increase in 1985–86. This upturn for all three degree levels in 1985–86 is surely more than coincidental. And not only has the number of history degrees increased, but also for the first time in over a decade and a half history’s share of the total number of degrees awarded in US colleges and universities has grown. The increase is less than a percentage point, but even that is welcome after so many years of decline.
As important as the “supply” side in any analysis of the status of the history discipline is the “demand” side. In light of the chronic shortage of jobs in his tory, the decline in the number of new history doctorates has been welcomed fewer candidates pursuing scarce posi tions. Should we then be concerned that an increase in the applicant pool will exacerbate employment problems? As is noted in another article in this section (see Noteworthy), at least one study suggests that oversupply will not be the problem but that we should be concerned instead about a possible faculty shortage in the 1990s. While there may be some dispute as to what we can expect in the next decade, there is no question but that the job market has improved in the last few years. If we look at the number of positions advertised in the EIB over comparable periods, we find that the number of announcements in 1987 was two and a third times that in 1982, when the EIB first became part of Perspectives. While the job crisis is far from over, it does seem to be abating.
The NRC report also provides demo graphic data on the discipline. Table 2 charts the changing ratio of men to women among PhDs in history over the period 1970–86. The percentage of history doctorates earned by women declined in 1984–85 for the first time since 1964, and then dropped another .1 point to 32.7 in 1985–86. While the decline is modest—only .8 of a point—it does bear notice, particularly within the context of comparable data on doctorates overall and in the humanities. In contrast to the decline in history, the percentage of doctorates awarded in all disciplines to women at US colleges and universities increased from 39.1 percent in 1984–85 to 40.9 percent in 1985–86, the largest increase for any subgroup analyzed by NRC. In the humanities, women have nearly reached parity, earning 45.2 percent of the doctorates awarded in 1986. The decline in the percentage of history doctorates earned by women thus represents a step backward for a discipline already lagging behind in achieving parity. It re mains to be seen whether 1984–86 represents an aberration in an otherwise steady trend or marks a change in direction.
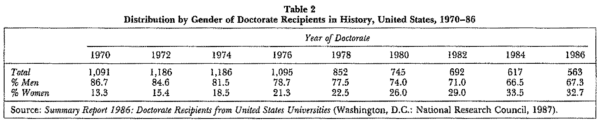
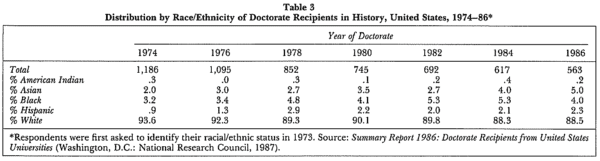
Table 3 breaks down the data on new doctorates by race and ethnicity. There are no clear trends here. While the percentage of degrees awarded to whites has generally declined, the share earned by minorities has remained disturbingly small, even decreasing by .2 percent in 1985–86. More degrees are now awarded to Asians and Hispanics,” but the share earned by blacks has declined and the number earned by American Indians has remained miniscule. Compared to a decade ago, 38 percent fewer blacks earned history doctorates in 1985–86, compared to a 10.8 decline for the humanities overall. The situation becomes more problematic when one looks at the gender distribution: the number of black males earning humanities doctorates dropped by 28 percent in 1985–86, while the number of black females earning humanities doctorates increased by 17 percent. Thus although men slightly outnumber women earning humanities doctorates overall, black women now outnumber black men by nearly 50 percent-a trend that carries over into the data for all doctorates awarded in the United States. The NRC does not provide comparable data for the history discipline, but we have every reason to believe that this intersection of race and gender extends to our discipline as well.
The NRC study also addresses postgraduation plans. History stands out within the humanities disciplines in two ways. First of all, historians are more likely than their colleagues to have postgraduate study plans. According to the NRC’s survey, 10.8 percent of the recipients of history doctorates have study plans (primarily fellowships), compared to 8 percent for the humanities overall. Secondly, although recent PhDs in history do not differ significantly from their colleagues in terms of the percent age with employment plans, far fewer historians plan on employment in academe. Only 54 percent of those earning history doctorates in 1985–86 planned to work in two-year colleges or four year colleges and universities, compared to 62.5 percent in philosophy, 71.3 per cent in English and American languages and literature, and 62.5 percent in foreign languages and literature. The interest of historians in nonacademic work in 1986 contrasts dramatically with the plans of recipients in the early 1970s. In 1972, just before the peak output of history doctorates, 75.5 per cent planned to go into academe. An other report from the NRC, Humanities Doctorates in the United States: 1985 Profile, corroborates this shift. While 23.1 percent of those who earned PhDs in history between 1942 and 1984 work outside of the academy, 39.6 percent of the 1979–84 cohort have not pursued academic careers. Clearly, the career structure of the profession has changed significantly in the past decade and a half.
In sum, we have good reason to be optimistic about the health of the his tory discipline. While full recovery remains a distant goal, the data from the National Research Council and the Department of Education testify to a nascent revival. On other fronts, the news is not good. Recent developments suggest that, despite current efforts to foster diversity within the profession, we have not yet resolved the problem of underrepresentation of women and minorities.
For more information, contact the Doctorate Records Project, National Re search Council, 2101 Constitution Avenue, NW, Washington, DC 20418, or the Education Information Branch, US Department of Education, 555 New Jersey Avenue, NW, Washington, DC 20208.