Has the Decline in History Majors Hit Bottom?
Data from 2018–19 Show Lowest Number since 1980
History has a majors problem. The number of students earning degrees in the field fell precipitously after the Great Recession of 2008, and while the decline became a bit more gradual before the pandemic (especially when including double majors), it has continued to slip. These numbers offer a key measure of the health of the discipline in academia, but they can also have a more tangible effect at many institutions, as administrators often use majors to allocate resources and faculty lines.

Although the total number of students earning BAs in history continues to decline, data from 2018–19 reveal that a slightly more diverse student body is earning those degrees. drpavloff/Flickr/CC BY-NC 2.0
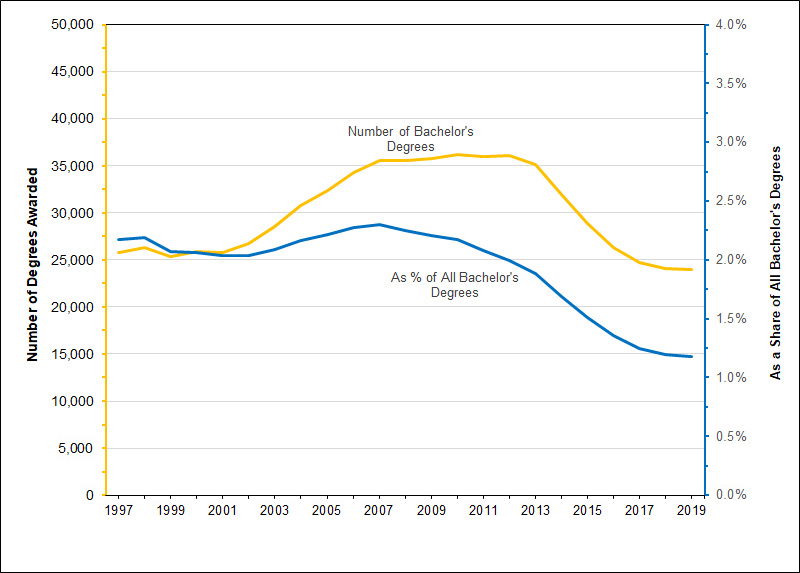
The raw numbers are grim. New US Department of Education data for the 2018–19 academic year shows the annual number of bachelor’s degrees awarded in history, history teacher education, and historic preservation and conservation fell to 23,923—down more than a third from 2012 and the smallest number awarded since the late 1980s (Fig. 1).

Fig. 1: Degree completions in history (absolute number and as a percentage of all bachelor’s degrees), 1997–2019 Data source: IPEDS Completions Survey from the US Department of Education
The good news, such as it is, was that the decline slowed significantly from 2018 to 2019 (down by just 140 bachelor’s degrees awarded). While a further decline is hardly something to celebrate, the contrast with the previous trend is quite notable. From 2012 to 2018, history bachelor’s degrees were falling at an average annual rate of over 7 percent per year, so slowing the descent to less than 1 percent suggests that trends could be in flux.
While the effects of the pandemic remain a significant unknown, the slowing of the recent declines in majors might reflect creative efforts by departments to reverse the trend. As reported in Perspectives in September 2017 (“Decline in History Majors Continues, Departments Respond”), by the mid-2010s, history departments were actively revising their courses and programs to attract students into the major. The timing of the recent easing from the more precipitous annual drops coincides with those efforts and provides some hope that the declines are nearing the bottom.
One crucial issue is “market share,” which is complicated in any context where choices are increasing. History departments trying to argue for institutional resources based on the number of students attracted to the major have to face the reality that the number of students earning degrees in other academic programs continues to grow (particularly in the health sciences). History’s share of bachelor’s degrees has been falling faster than the total number of degrees. As of 2019, history accounted for slightly less than 1.2 percent of all bachelor’s degrees awarded, the lowest share in records that extend back to 1949. For comparison, in 1967, history accounted for 5.7 percent of all bachelor’s degrees, but that number fell to as low as 1.6 percent in the mid-1980s before rising again. Perhaps most notably, the recent changes have been pervasive across almost all demographic groups and institution types.
The good news, such as it is, was that the decline slowed significantly from 2018 to 2019.
However, the decline is not universal. Of the 1,255 colleges and universities that awarded a history bachelor’s degree in 2012, 214 (17 percent) were conferring a larger number of degrees seven years later. But only a small handful of colleges showed substantial growth in their history degrees over that time span, most notably Southern New Hampshire University and Liberty University, which have developed large online programs; they are the only colleges where the number of history degrees awarded increased by more than 100 from 2012 to 2019.
Those exceptions prove the rule: Very few history departments have been spared from the drop in majors, regardless of whether they are at public or private institutions, in any region of the country. Seventy-three institutions awarded no history degrees in 2019, and another 907 conferred fewer degrees. The declining appeal of history majors appears as widespread as it is large.
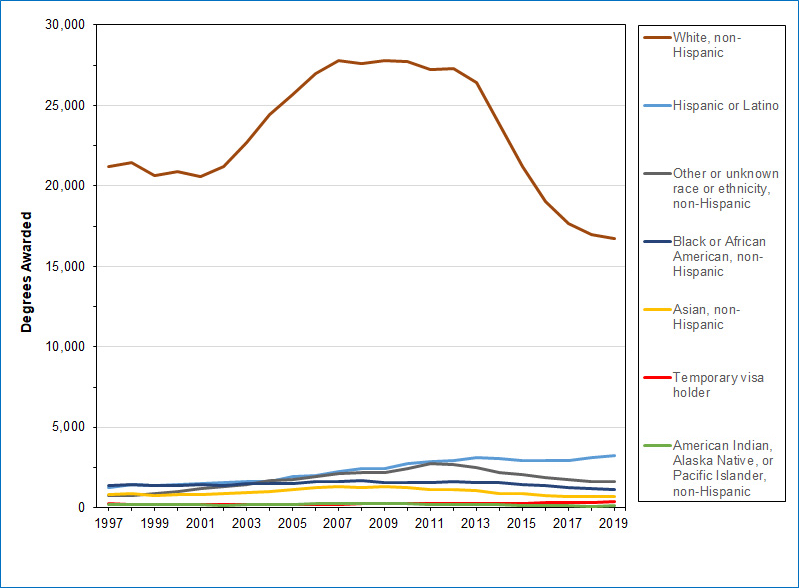
There was, however, a notable divergence in the demographics of the students earning degrees in history (Fig. 2). History has traditionally been one of the least diverse disciplines in race, ethnicity, and gender. In relative terms, the share of history bachelor’s degrees awarded to white, non-Hispanic Americans has been trending down for decades; it fell to slightly below 70 percent in 2019 for the first time on record. Much of the recent change has occurred due to a substantial increase in the percentage of Hispanic or Latinx students in higher education, whose share of history bachelor’s degrees sprang from 8.1 percent in 2012 to 13.5 percent in 2019, roughly in line with demographic shifts among all degree recipients.

Fig. 2: Number of bachelor’s degrees in history awarded to members of racial/ethnic groups, 1997–2019 IPEDS Completions Survey from the US Department of Education
The change in terms of relative percentages, however, masks a more dramatic change in the actual number of degrees awarded to each demographic group. While the overall number of degrees awarded in history fell sharply from 2012 to 2019, the number of graduates of Hispanic/Latino descent increased by 11 percent (from 2,925 degree recipients to 3,234). The only other demographic category to exhibit growth over that time was temporary visa holders, which increased 45 percent (albeit from a relatively modest 253 to 368). In comparison, the number of white and Asian American students earning undergraduate degrees in history fell by slightly less than 40 percent over the same span, while the number of American Indian, Alaska Native, and Pacific Islander degree recipients fell by 49 percent and African American recipients fell by 29 percent.
Despite these recent changes, history remains considerably less diverse than the overall undergraduate student population: 56 percent of all bachelor’s degree recipients in 2019 were white, non-Hispanic compared to almost 70 percent of the graduates from history programs. While the representation of Native Americans in history is slightly higher than the average for all degree recipients (0.6 percent compared to 0.4 percent) and the share of Hispanic or Latino students in history is approaching parity with the average (13.5 percent compared to 14.5 percent), history remains well below the average in its share of Black degree recipients (4.8 percent compared to 9.3 percent) and Asian Americans (2.8 percent versus 7.2 percent).
History remains considerably less diverse than the overall undergraduate student population.
Alongside the racial and ethnic disparities among degree recipients, history’s long-term gender disparities appear to have calcified in recent years. While the share of women earning bachelor’s degrees across academia has been at or near 57 percent for the past 20 years, in history that share topped out at almost 42 percent in 2001 and then drifted down to below 40 percent in 2014. The share increased slightly in recent years but remains stuck below 41 percent, an outlier among the humanities disciplines.
Regrettably, one can only speculate about the disparities, as the data does not speak to the “why” of these trends, only the “where” and the “who.” But if you find your program struggling to attract majors, rest assured that you are not alone.
Additional resources from the AHA
- Department Advocacy Toolkit
The AHA has assembled this toolkit to help departments, administrators, advisers, and students navigate the AHA's library of resources in order to better articulate the value of studying and majoring in history. If you're looking for data, personal narratives, or department strategies, this guide is for you.
- History Gateways
The AHA has received a $1.65 million grant from the Andrew W. Mellon Foundation to partner with the John N. Gardner Institute for Excellence in Undergraduate Education and 11 institutional partners to lead “History Gateways,” an evaluation and substantial revision of introductory college-level history courses to better serve students from all backgrounds and align more effectively with the future needs of a complex society.
- “Why Study History? Revisited” by Peter N. Stearns, Perspectives Daily, September 18, 2020.
Two decades after writing a powerful response to the question "why study history," Peter Stearns revisits his answer.
Robert B. Townsend is interim director for humanities, arts, and culture programs at the American Academy of Arts and Sciences and co-director of the Humanities Indicators project. He tweets @rbthisted.
Tags: Features Teaching & Learning K-16 Education The History Major

This work is licensed under a Creative Commons Attribution-NonCommercial-NoDerivatives 4.0 International License. Attribution must provide author name, article title, Perspectives on History, date of publication, and a link to this page. This license applies only to the article, not to text or images used here by permission.
The American Historical Association welcomes comments in the discussion area below, at AHA Communities, and in letters to the editor. Please read our commenting and letters policy before submitting.
Comment
Please read our commenting and letters policy before submitting.


