Features
The Troubled Academic Job Market for History
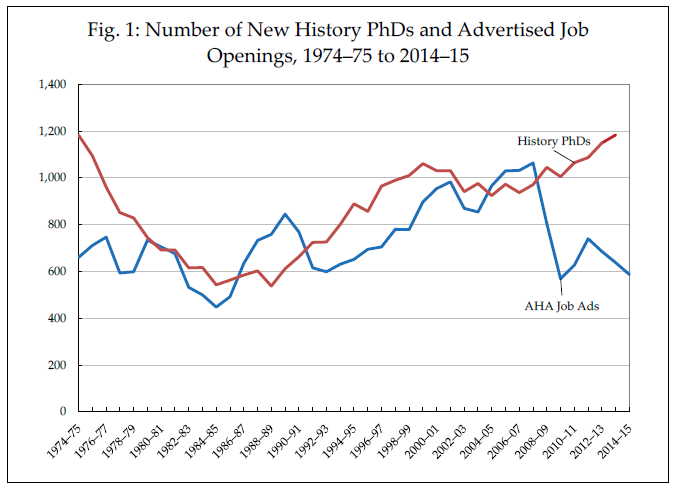
The academic job market in history remains quite challenging for recent PhDs, and evidence from the AHA’s Directory of History Departments, Historical Organizations, and Historians (the Directory) indicates that these challenges are likely to persist. Among the signs of difficulty for academic-job candidates today and into the near future: (1) the number of positions advertised with the AHA over the past year fell for the third year in a row, (2) the number of tenured and tenure-track faculty lines fell slightly over the past five years, and (3) evidence indicates that a relatively small share of full-time faculty will be approaching retirement within the next decade.1
The data reported here represent academic positions that have been advertised with the AHA; this is a subset within the broad range of jobs that historians pursue and perform. An in-depth study conducted by the AHA in 2013 found that 24 percent of those who had earned a history doctorate 3 to 15 years earlier held positions beyond the professoriate.2 The AHA’s ongoing Career Diversity for Historians project highlights the extensive scope of such opportunities and provides professional development resources for both history doctoral students and graduate programs.3 Finally, many positions in postsecondary history teaching—at two-year colleges, for example—are advertised primarily through institutional and local job boards, and are not part of the data set in this analysis.
An Anemic Job Market

In comparison, the percentage of job advertisements for other geographic fields were comparable to their shares among recent PhDs. For instance, 14.8 percent of advertisers sought a specialist in European history, which was just below the 19.4 percent share of PhD recipients in 2014. Another 9.0 percent of advertisers searched for an Asian history specialist (slightly higher than the 6.6 percent share of new PhDs), and around 5 percent each for specialists in the history of Latin America and the Middle East or North Africa (slightly below the 6.6 and 6.2 percent shares, respectively, among new PhDs). Another 4.4 percent of job ads were for a historian of Africa (as compared to 2.7 percent of new PhDs). Aside from postings that specified a geographic focus, nearly a third were either open or focused primarily on a topical or professional specialty. The largest of the topical specializations was the history of religion (accounting for 3.6 percent of the advertised positions). Digital history was the predominant professional skill sought by advertisers (serving as the primary criteria for 2.6 percent of the openings, and mentioned as a beneficial skill in an additional 5.5 percent of the listings).
The Trend over the Past 15 Years

The Directory currently contains entries from 640 college and university history departments. Faculty listings for 556 US history departments from the past 15 years provide a partial answer to these questions. From 2000 to 2010, the number of full-time tenured or tenure-track faculty members increased (from 8,280 to 8,790), but by 2015, the number had contracted slightly (falling to 8,751).
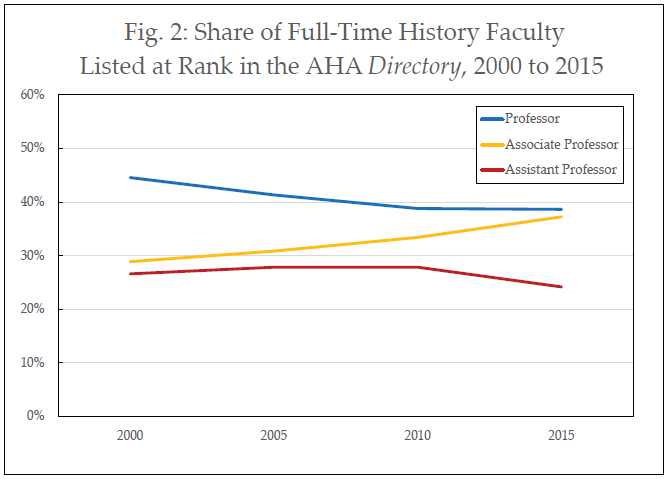
Among the full-time faculty members listed in the departments, there was also a notable shift in balance between the ranks (fig. 2). In 2015, 24 percent of full-time faculty members were at the rank of assistant professor—a drop of 4 percentage points from 2010 and the lowest level in the 15 years surveyed. In comparison, 37 percent of full-time faculty were at the rank of associate professor (up 8 percentage points from 2000), with 39 percent at the rank of full professor (also the lowest level since 2000).
The Directory does not offer enough evidence to answer questions about whether there has been a significant increase in the number of faculty in part-time and adjunct appointments, but it is nevertheless an excellent source for understanding issues related to history departments at four-year institutions and their long-term staffing picture.7 Among the four-year institutions whose departments provide Directory entries in the annual volume, multi-year, full-time faculty members are the most likely to be represented. Departments appear less likely to include lists of faculty members on short-term contracts and in positions that are often filled at the last minute. (For comparison, while 10 percent of the listed faculty in the Directory were employed in part-time or adjunct positions, a recent survey of faculty at four-year institutions found approximately 28 percent of faculty members employed in those positions.)8 The number of faculty listed in part-time and adjunct positions shrank from 2010 to 2015—falling from 1,596 to 1,397 of the listed faculty (close to the 1,394 listed in the 2000 Directory). Faculty listed in joint appointments are not included in the faculty counts above, since the nature of the appointments and the division of responsibilities between departments could not be determined. But the trend here is notable, with the number rising from 654 in 2000 to 802 in 2010, and reaching 862 in the current Directory. Whether this trend reflects a move to share labor costs among college and university departments that otherwise could not afford to hire, or a growth in interdisciplinarity, remains a subject for further exploration.
The End of the Boomer Bubble

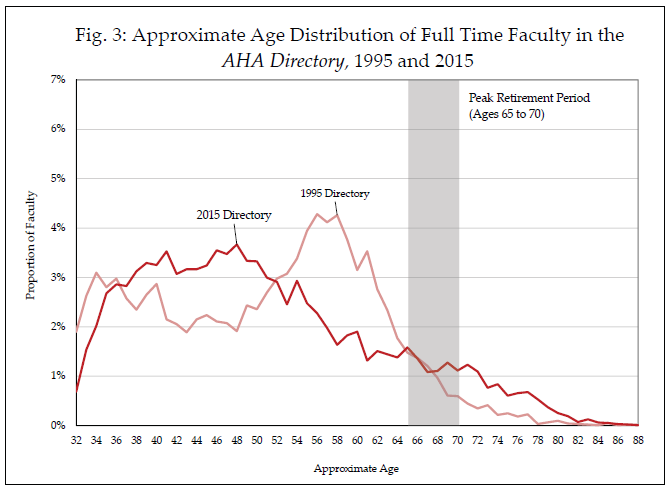
But as of 2015, that wave has largely passed, and lingers as a significant increase only in the share of full-time faculty over the age of 70 (which has risen from 7 percent in 1995 to 17 percent in 2015).10 An unusually small percentage of full-time faculty are now approaching retirement. As of 2015, 22 percent were ages 54 to 64—the lowest recorded level in that cohort since the 1980 Directory, when the end of a wave of hiring in the 1960s and early 1970s meant that just 19 percent of the faculty were approaching retirement (and only 2 percent of the faculty were over the age of 70).
The current age profile of historians in academia represents a significant challenge for doctoral students focused on academic employment and the departments preparing them, as it suggests that the ebb in open tenure-track positions is likely to linger over the next decade. Barring a significant increase in student enrollments to create pressure for new faculty, the demographics of departments today indicate that there will be relatively few full-time positions opening up to replace retiring faculty.
Robert B. Townsend is the author of History’s Babel: Scholarship, Professionalization, and the Historical Enterprise, 1880–1940 (Univ. of Chicago Press, 2013). When he is not studying history, he oversees the Washington office of the American Academy of Arts and Sciences and the Humanities Indicators. Julia Brookins is special projects coordinator at the AHA.
Notes
1. For analyses of the past two years of jobs data, see Allen Mikaelian, “The Academic Job Market’s Jagged Line: Number of Ads Placed Drops for Second Year,” Perspectives on History, September 2014, historians.org/publications-and-directories/ perspectives-on-history/september-2014/the-academic-job-markets-jagged-line; and Allen Mikaelian, “The 2013 Jobs Report: Number of AHA Ads Dip, New Experiment Offers Expanded View,” Perspectives on History, January 2014, historians.org/publications-and-directories/perspectives-on-history/january-2014/the-2013-jobs-report-number-of-aha-ads-dip-new-experiment-offers-expanded-view.
2. L. Maren Wood and Robert B. Townsend, The Many Careers of History PhDs: A Study of Job Outcomes, Spring 2013, available through the AHA website at historians.org/manycareers.
3. See historians.org/careerdiversity.
4. While there are other outlets for job advertisements in the discipline (H-Net, institutional websites, and local jobs websites for many short-term contract positions), recent research indicates that “societies’ job listings data are useful measures of the demand for new PhD recipients.” Ronald G. Ehrenberg, “The Usefulness of Societies’ Job Listings Data,” Academy Data Forum, www.amacad.org/content/research/dataForumEssay.aspx?i=21673.
5. The annual Survey of Earned Doctorates (www.sedsurvey.org) provides the best measure of new history PhDs potentially entering the job market, since it allows new doctoral degree recipients to self-define the discipline of their degree and captures students who are earning degrees outside core history departments. Tabulations for the years 1973 to 2013 were drawn using the National Science Foundation’s WebCASPAR system at ncsesdata.nsf.gov/webcaspar. The estimate for 2013–14 is based on the growth between 2012–13 and 2013–14 in the number of reported history PhDs in the narrower Integrated Postsecondary Education Data System (IPEDS) degree completions survey, downloaded from the IPEDS Data Center at nces.ed.gov/ipeds/ datacenter.
6. Comparative data taken from the 2014 federal Survey of Earned Doctorates, Table 13, available at www.nsf.gov/statistics/2016/nsf16300/data/tab13.pdf.
7. The entries are (with a single exception) from four-year institutions, meaning we have no data on staffing patterns at the two-year institutions that serve so many American college students and employ many non–tenure-track instructors.
8. Susan White, Raymond Chu, and Roman Czujko, The 2012–13 Survey of Humanities Departments at Four-Year Institutions (College Park, MD: Statistical Research Center, American Institute of Physics, 2014). Study conducted for the American Academy of Arts Sciences’ Humanities Indicators Project. See Table HDS-H2 at humanitiesindicators.org/content/indicatordoc.aspx?i=626.
9. The approximate age of each faculty member was calculated by taking the year of doctoral degree listed in the Directory and adding 32 years—the median age at degree found among senior faculty in a survey of 2,240 associate and full professors listed in the 2012 Directory. The median age of all new history PhDs reported in the Survey of Earned Doctorates has been two to three years higher than this for the past three decades, but the findings in the survey suggest that scholars who are younger when they complete the PhD are more likely to find their way into tenure-track positions. See “What Makes a Successful Academic Career in History? A Field Report from the Higher Ranks,” Perspectives on History, December 2012, historians.org/publications-and-directories/perspectives-on-history/ december-2012/what-makes-a-successful-academic-career-in-history. The median age for new history PhDs has been consistently between 34.5 and 35.5 years, according to annual issues of the summary report Doctorate Recipients from US Universities, available at www.nsf.gov/statistics/doctorates.
10. The findings here appear to confirm a recent survey that found three-quarters of middle to late-career faculty planned to work past the age of 65. Colleen Flaherty, “Working Way Past 65,” Inside Higher Ed, July 17, 2013, www.insidehighered.com/news/2013/06/17/data-suggest-baby-boomer-faculty-are- putting-retirement.

This work is licensed under a Creative Commons Attribution-NonCommercial-NoDerivatives 4.0 International License. Attribution must provide author name, article title, Perspectives on History, date of publication, and a link to this page. This license applies only to the article, not to text or images used here by permission.
The American Historical Association welcomes comments in the discussion area below, at AHA Communities, and in letters to the editor. Please read our commenting and letters policy before submitting.
Tags: History News Professional Life Employment & Careers Job Markets Resources for Early Career Resources for Graduate Students Resources for History Departments
Comment
Please read our commenting and letters policy before submitting.


