Jobs Lag as New PhDs Continue to Increase
Preliminary data from an annual survey conducted by the National Research Council (NRC) indicates another year of growth in the number of new Ph.D.s awarded in history. This constitutes the second consecutive year of growth after the decline reported for 1989. and data on graduate enrollments compiled by the Council of Graduate Schools suggests that we can expect more growth in the future. But at the same time that the supply side of the profession seems to be stabilizing, if not growing, the demand for historians appears to be shrinking—for the second year, the number of position announcements in the Employment Information section of Perspectives has decreased, hitting the lowest level in six years.
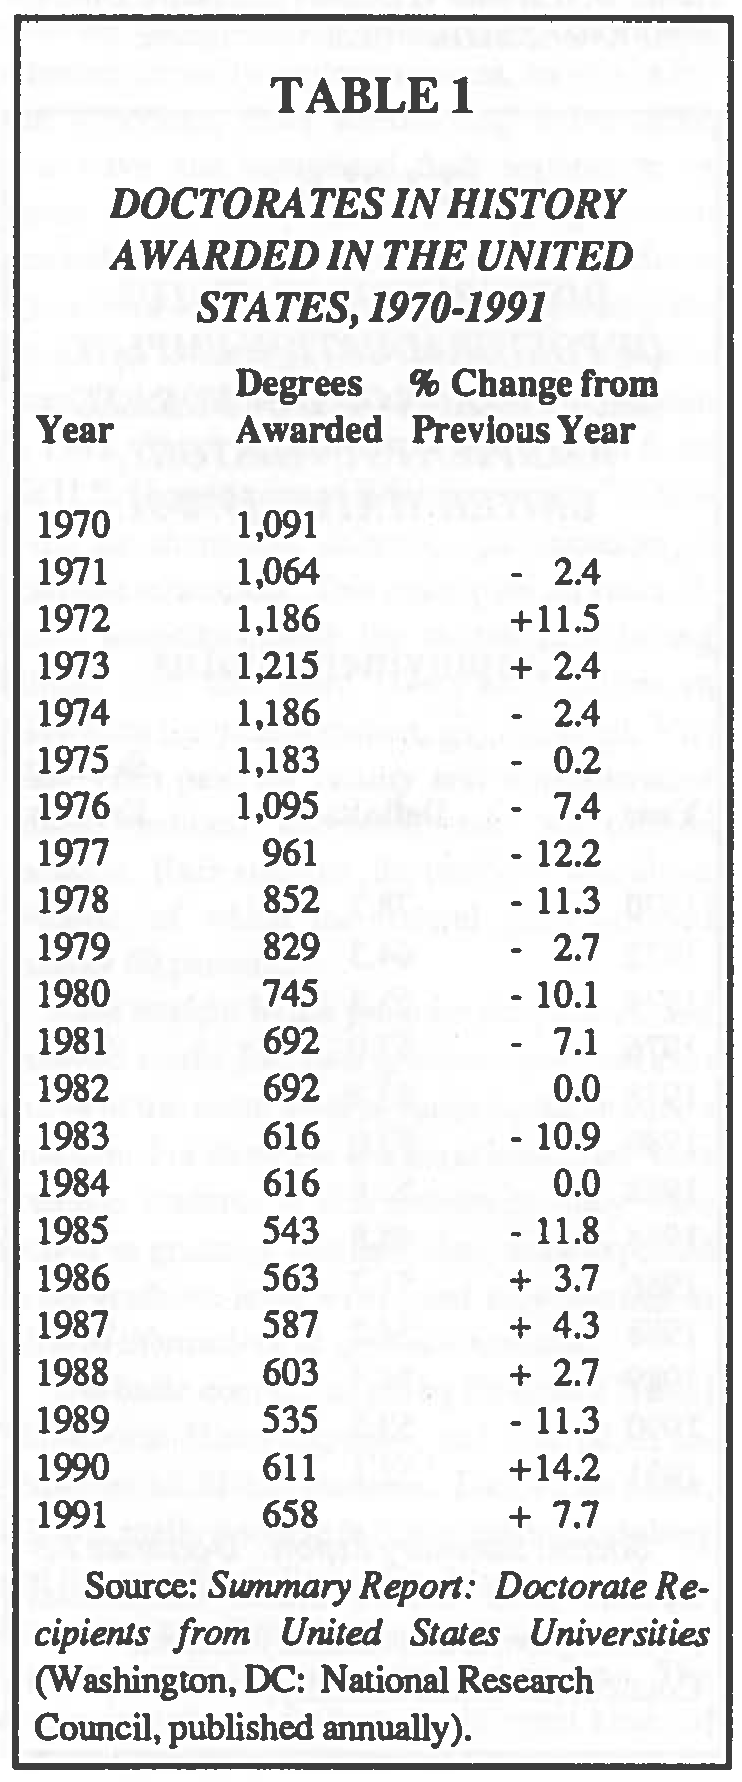 According to the NRC (see Table 1), 658 individuals received doctorates in history in 1991, an increase of 7.7 percent over the number reported in 1990 and 23 percent above the 1989 1evel. The last was a record low-the lowest in at least two decades-and to some extent we are still playing "catch up." While the 1991 cohort is the largest reported since 1982, the average of the past three years is still slightly below that reached prior to the 1989 drop.
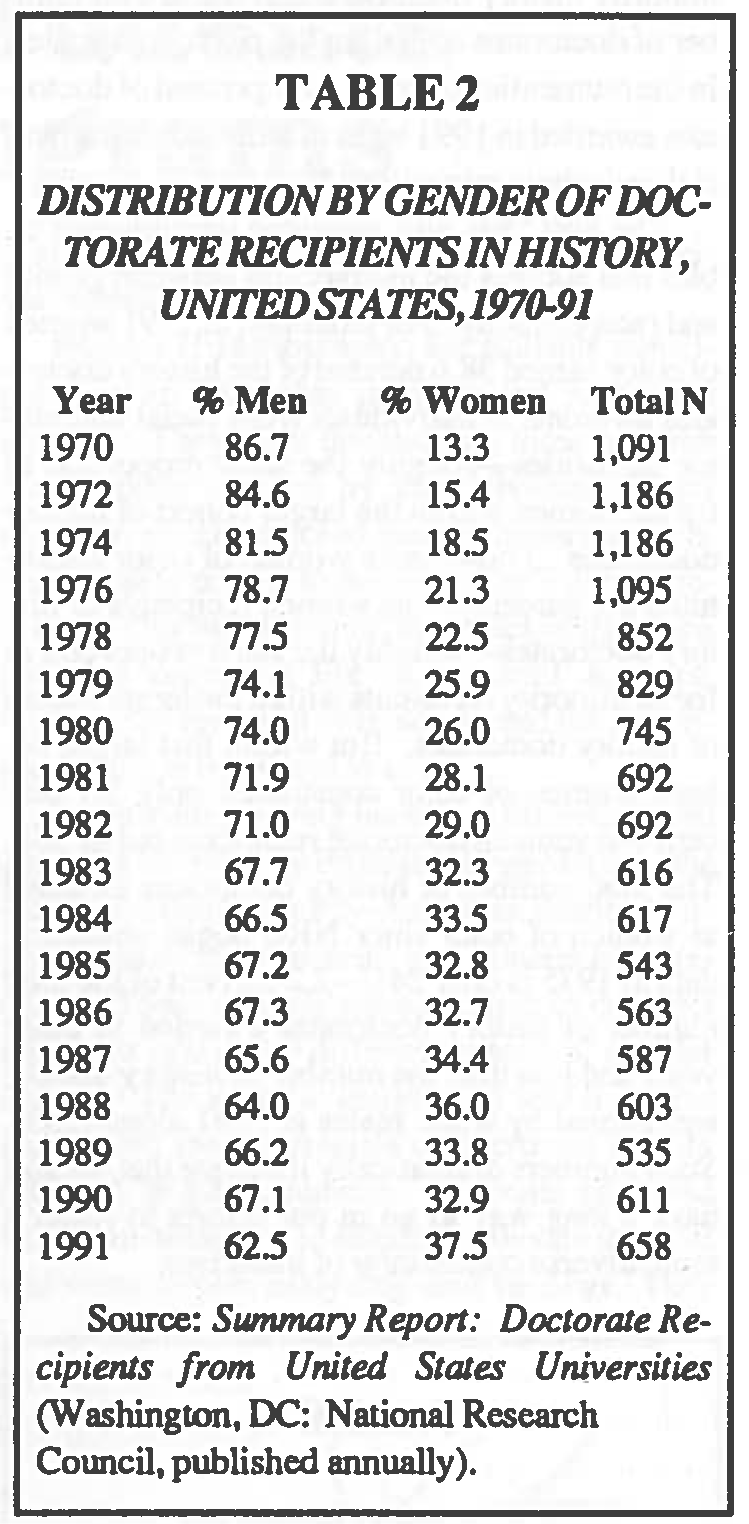
Demographically, the 1991 cohort of history doctorates differs somewhat from that of previous years. The most striking change is in the percentage of history doctorates earned by women: in 1991, 37.5 percent were awarded to women, the highest level ever (see Table 2). This comes after two years in which the percentage of history Ph.D.s earned by women had declined after a high of 36 percent in 1988. As in the past, however, history continues to lag behind other humanities disciplines in achieving parity—the percentage of humanities doctorates overall earned by women increased in 1991 to 46.5.
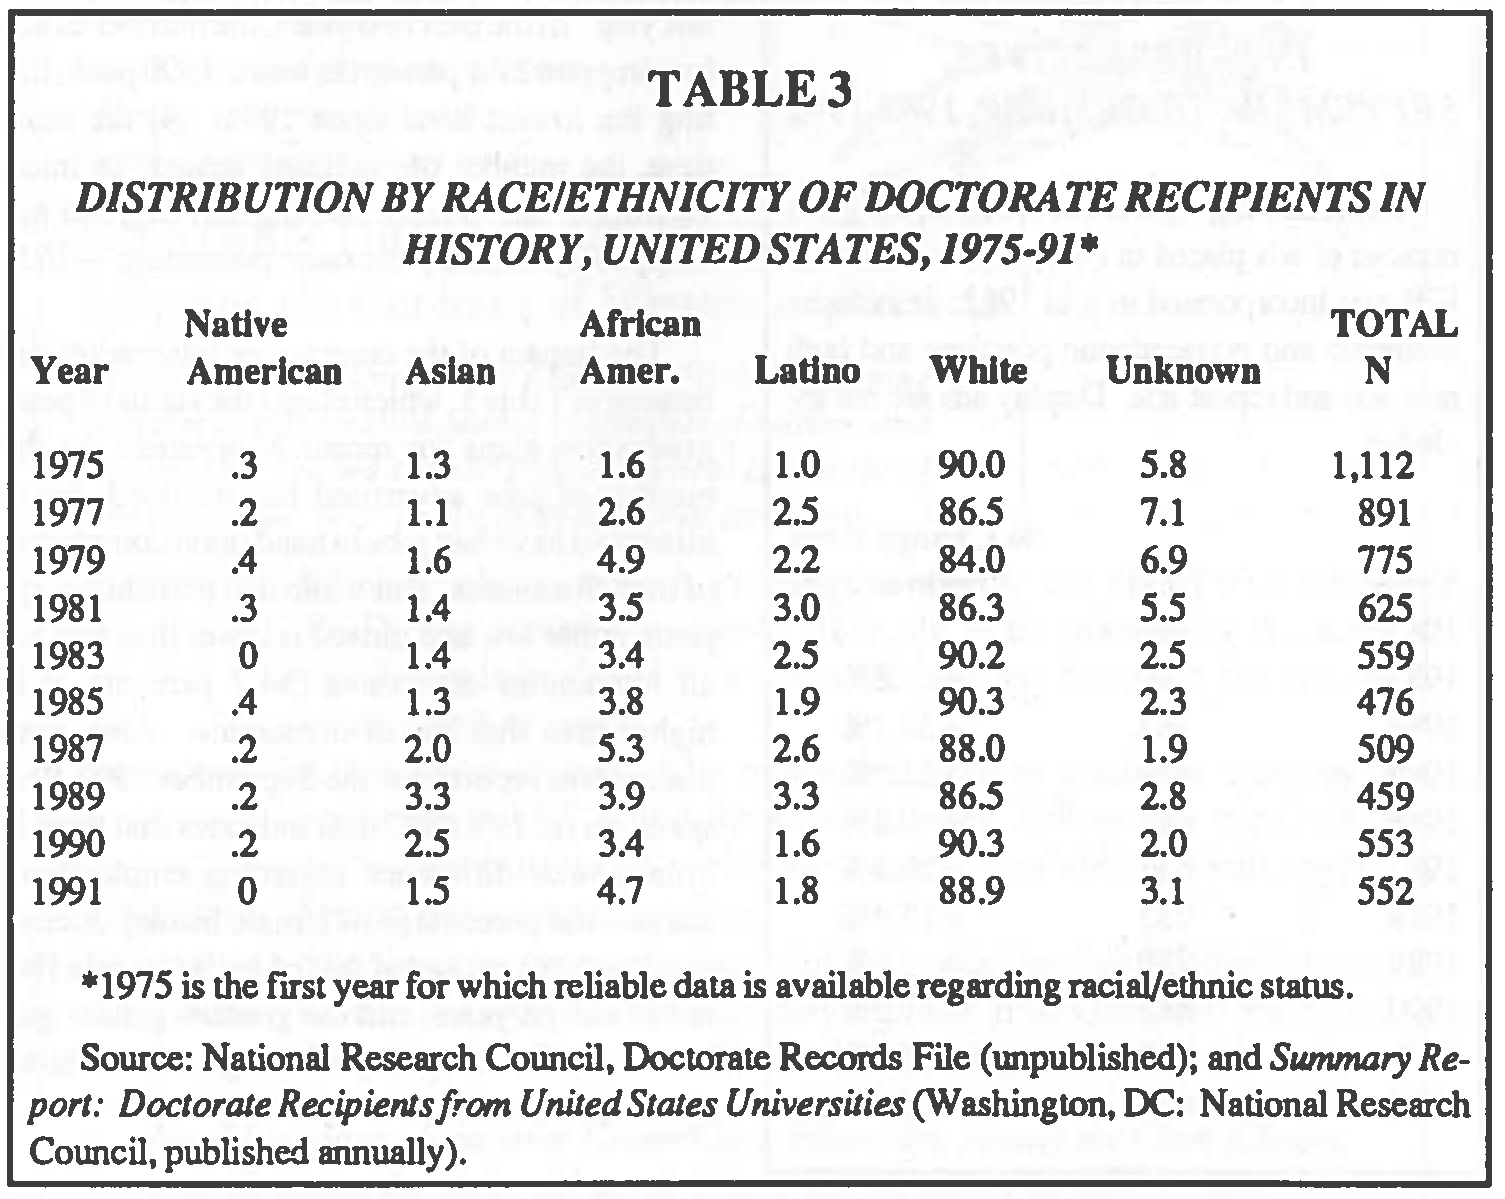
 The percentage of history doctorates earned by individuals from racial and ethnic minorities increased only slightly in 199I—from 7.7 percent in 1990 to 8.0 percent in 1991 (see Table 3). It is difficult to discuss trends in this area because of the relatively small number, involved, but the 1991 level is slightly below the average for the past ten years (8.2 percent) and just above that for the entire seventeen-year period for which we have reliable data (7.8 percent). In only two years has the percentage of minority recipients reached double digits-in 1989 (10.7 percent) and 1987 (10.1 percent). Interestingly, the same year (1989) produced the highest percentage of minority history doctorates and the lowest number of doctorates overall in the past two decades. In the humanities over all, 11.7 percent of doctorates awarded in 1991 went to individuals from racial and ethnic minorities.
 The NRC has also provided unpublished tables that address the intersection between gender and race/ethnicity. For example, in 1991 women of color earned 38.6 percent of the history doctorates awarded to individuals from racial and ethnic minorities—roughly the same proportion as for all women within the larger cohort of history doctorates. Those same women of color constituted 8.1 percent of the women recipients of history doctorates—roughly the same proportion as for all minority recipients within the larger cohort of history doctorates. But within that larger cohort, women of color constituted only 3.1 percent—seventeen doctorate recipients out of 552. The total number of history doctorates awarded to women of color since NRC began collecting data in 1975 is only 241-2.2 percent of the total number of history doctorates awarded in those years and less than the number of history doctorates earned by white males in 1991 alone (303). Such numbers dramatically illustrate that we still have a long way to go in our efforts to foster a more diverse community of historians.
An annual survey of graduate enrollment conducted by the Council of Graduate Schools and the Graduate Record Examinations Board indicates that we should expect continued growth in the supply of historians. According to the COS/ORE data, graduate enrollment in history has been growing on average between 6 and 7 percent per year over the past five years, which is roughly twice the average rate of growth in doctorate recipients for the same period. The history pipeline is clearly full, assuming that a significant portion of those students complete their degrees. In contrast, the average rate of growth in graduate enrollment in the humanities and in all fields combined has been less than the average rate of growth in doctorate recipients in those same areas, suggesting that the long-predicted shortage of Ph.D.s may still occur, but just not in history.
All we know demographically about the history graduate student population is that 40 percent are women—a slightly larger proportion than we find in the annual cohorts of new doctorate recipients. The fact that a majority of the graduate students are men distinguishes history from all humanities (44-45 percent male) and all disciplines combined (48-49 percent male).
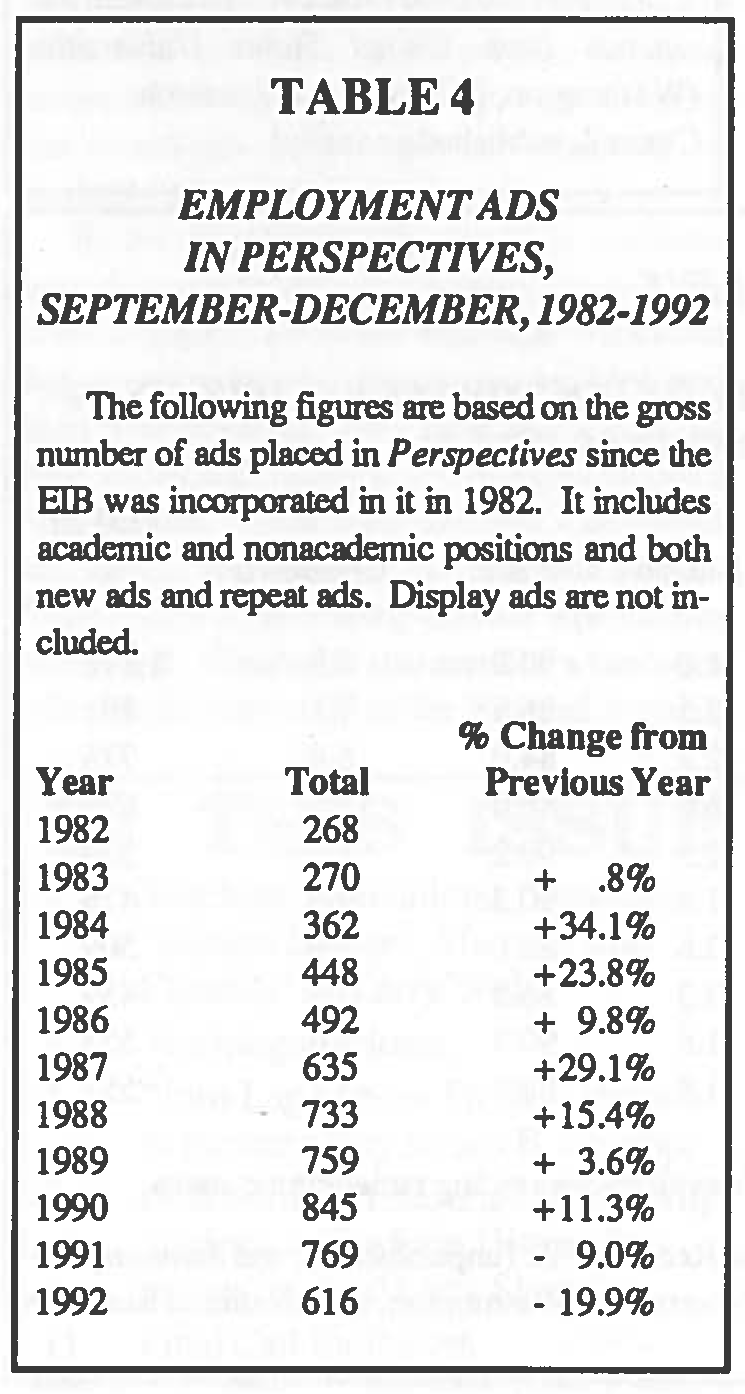 What about the demand side? As indicated above, the number of position announcements being placed in Perspectives is down considerably this year. Table 4 charts changes in the gross number of ads placed in the newsletter in the fall months over the past decade. The number of ads increased for eight years, reaching a peak of 845 in 1990 before beginning to drop in 1991. The number of ads has declined this year another 19.9 percent, over twice the percentage drop reported last year, in the past two years, the number of ads has dropped 27.1 percent from the 1990 peak, hitting the lowest level since 1986. At the same time, the number of positions posted for interviewing at the Annual Meeting Job Register has dropped by virtually the same percentage—26.9.
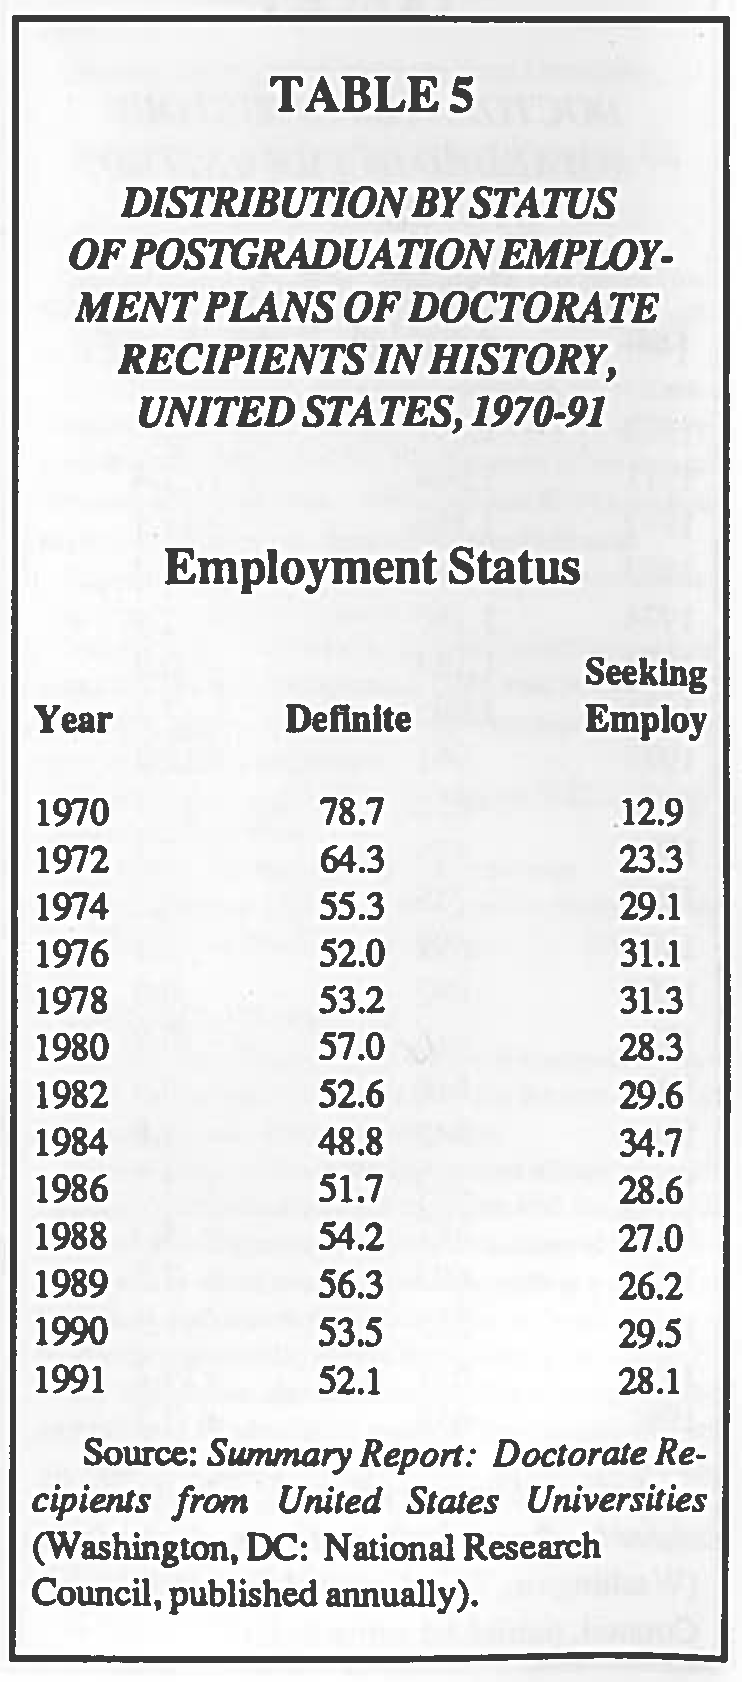 The impact of the contracting job market can be seen in Table 5, which charts the status of post-graduation plans for recent doctorates. As the number of jobs advertised has declined, fewer historians have had jobs in hand upon completion of their doctorates. But while that percentage appears rather low and indeed is lower than that for all humanities doctorates (54.7 percent), it is higher than that for all doctorates. Also, note that, as was reported in the September 1992 Perspectives (p. 19), NRC data indicates that there is little gender difference regarding employment status-the percentage of female history doctorates hired has exceeded that of males in only five out of eleven years, and the greatest gender gap was in 1981, when the percentage of men hired exceeded that of women by 12.6 percent.
While the impact of the recession certainly appears to have taken a grim toll on the job market for historians, perhaps we can take some comfort in the greater misery of others. The Modern Language Association reports that the number of position listings in English and foreign languages began to decline a year earlier than in history, making this their third year of contraction.
When the recession will end and what that end will mean for hiring is not clear. Budgets may ease and hiring resume, or many of the positions now going unfilled may be lost for good. Nor can we predict what will be the impact of the end to mandatory retirement for college and university faculty at the end of 1993. We are already seeing early retirement offers being used as a means cutting out faculty positions, and that trend may not end soon, particularly in the context of debates about faculty accountability and work-loads. But while we cannot predict the future, we will try to keep you as well informed as possible about the current status of the profession.
James B. Gardner is Deputy Executive Director of the American Historical Association.
Tags:
Comment
Please read our commenting and letters policy before submitting.


