Survey Finds More PhDs, Less Success in Job Market
History Cohort Larger, Older, and More Diverse Says Second Study
The growth of new history Ph.D.’s has accelerated according to a National Research Council (NRC) survey of 1994 PhD recipients. The 800 PhD’s produced in 1994 represent a sharp increase from 728 the year before, and the highest level of degrees produced since 1980.1 This is reflected in a separate NRC survey, which found that the number of employable history Ph.D.'s has reached its highest point ever, increasing to 22,500 from the 21,800 Ph.D. recipients reported in an NRC survey conducted in 1991.2
 Among the 1994 Ph.D.'s, the proportion of women rose to its second highest level on record, with 295 female Ph.D.'s making up 36.9 percent of the total Ph.D.'s produced. At the same time, the percentage of minorities receiving history Ph.D.’s rose to it highest level ever, reaching 10.8 percent in 1994.
The 1994 history Ph.D. recipients spent the least total time working toward the degree of any group of recipients since 1982. Time elapsed to receipt of degree fell from 12.1 years in 1993 to 11.6 years in 1994. Nonetheless, the 1994 recipients were registered an average of 8.6 years during the time that they were pursuing their degrees—this is the longest registered time to receipt of degree of any field except anthropology. This helps explain why history Ph.D.'s are among the oldest at the time of degree among the disciplines, averaging 353 years of age. Female history Ph.D.'s spent a longer time working toward the degree than their male counterparts, averaging 123 total years to the male Ph.D.'s average 11.3 years.
Employment and Hiring Patterns
As noted in last month's issue of Perspectives, the sharp increase in new history Ph.D.’s places further pressure on the already tight supply side of the job market. This was reflected in the lowest reported level of employment at the time of degree the NRC began collecting data in 1970. 47.4 percent of history Ph.D. recipients reported "definite" employment plans when they received their degree (down from 49.9 percent the year before), while 35.4 percent reported they were still "seeking employment" (up from 32.1 percent). There was also a significant increase in the number of history Ph.D. recipients pursuing postdoctoral studies instead of immediate employment. After remaining stable at 10 percent for the last two years, the percentage of history Ph.D.’s seeking postdoctoral work rose to 10.9 in 1994 according to the NRC survey.
Sixty-eight percent of the 1994 degree recipients planned to work in educational institutions, compared to 3.9 percent planning employment in private industry, 3.4 percent who intended to work in the government, and L9 percent who will reportedly work in the nonprofit sector.
Although underrepresented in the total number of Ph.D.'s produced, in proportion to their numbers women were more successful in finding entry-level employment than their male counterparts. At the time they received degrees, 50.5 percent of women reported that they had secured employment compared to 45.5 percent of men. Only 30.8 percent of women were still seeking employment compared to 38 percent of male history Ph.D. recipients. Until 1989, male history Ph.D.’s had a significant (5 to 10 percent) advantage in hiring.
 Behind the 1994 figures are significant geographical differences in hiring. In proportion to their smaller numbers, female history Ph.D.'s were more successful than their male counterparts in finding employment in the North, particularly in the East North Central region (Illinois, Indiana, Michigan, Ohio, and Wisconsin), where an equal number of male and female history Ph.D.'s were hired after graduation. Men had slightly greater success in finding employment in the South and West.
A Snapshot of the Cohort of History Ph.D.'s
A separate NRC study profiles humanities doctorates who received their degrees from U.S. institutions between 1942 and 1992, who were under age 76, and who were resident in the United States at the time of receipt The study found the largest number of history Ph.D.'s on record, up to 22,500 from the 21,800 reported in the NRC's 1991 survey. With 21 percent of the humanities Ph.D.’s, history composes the second largest portion of humanities Ph.D.'s behind English, which comprises 25 percent with 27,000 Ph.D.'s.
Given the high state of concern with the job market, it is notable that 97.9 percent of history Ph.D.’s in the labor market (20,100 of the 22,500 in the cohort) were employed in 1993. Unfortunately, history Ph.D.'s are among the most likely to ultimately seek work that is not related to their degree. Only 66.6 percent of employed history Ph.D.'s reported that their principal job is "closely related" to the field of their doctorate. That is lower than any other humanities discipline except English language and literature, where only 63.8 percent of Ph.D. recipients found jobs closely related to their field of study. The principal reason cited by history Ph.D.'s for working outside their field was the lack of a job in their discipline (50 percent) or a change in career or professional interest (20.4 percent).
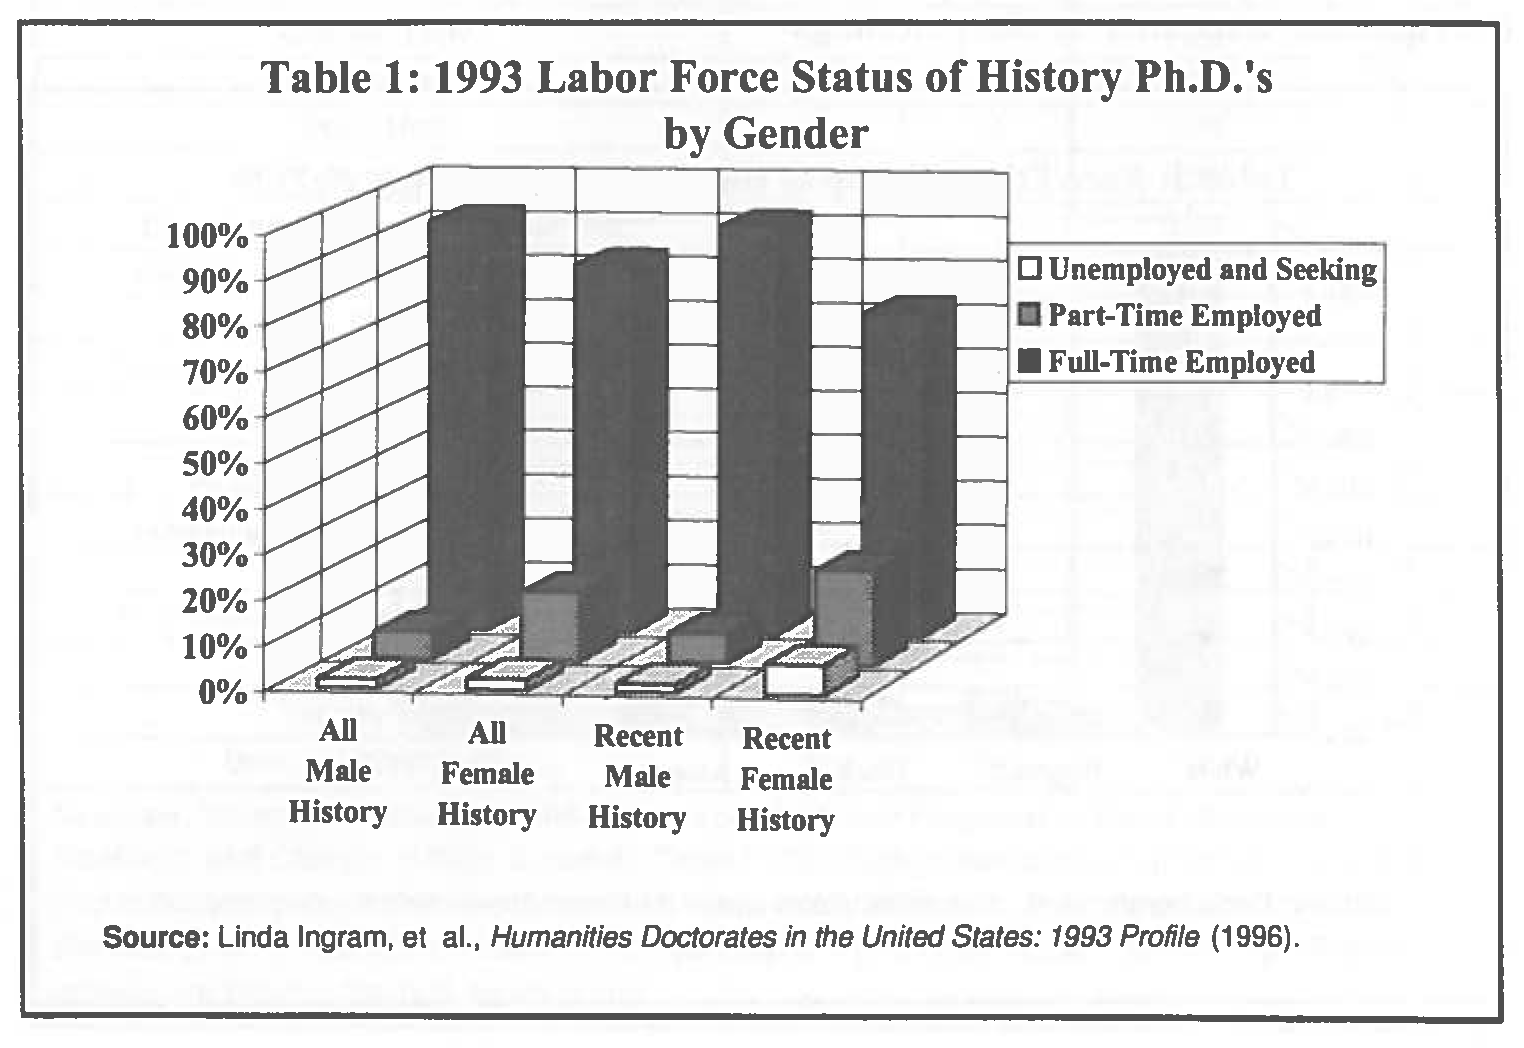
Another element of concern is further evidence of an increase in the number of history Ph.D.'s working part time, which the AHA has been finding in its own surveys.3 As Table 1 indicates, the number of history Ph.D.'s working part time is now 7.8 percent of the history labor force, with women making up a disproportionate part of this figure. Fifteen percent of female Ph.D.'s were working part time, while 5.9 percent of their male colleagues were employed part time. Women were also marginally more likely to be "unemployed and seeking work" than their male counterparts. Two percent of male history Ph.D.'s were seeking employment, compared to 2.4 percent of women Ph.D.'s.
A survey of recent graduates (1988-93) offers better evidence of the current state of the job market. These more recent degree recipients are more likely to be working part time (11.4 percent of the total) and more likely to be unemployed and seeking work (3.4 percent of the total). And the differences between the genders are more pronounced. Recent female history Ph.D.'s are considerably more likely to be working part time (20.9 percent compared to 6.6 percent of males) and more likely to be unemployed and seeking work (6.5 percent compared to 1.9 percent of men).
 The survey does provide some good news for the history profession: at $48,200, the average salary for history Ph.D.'s is the highest in the humanities. Among the other humanities disciplines, the closest comparable salaries were for philosophy Ph.D.'s, who had an average salary of $43,500.
It will come as little surprise that salaries for humanities Ph.D.'s in educational institutions are considerably lower than for their colleagues outside the academy. The average salary for humanities Ph.D.'s working in educational institutions was $42,800. But the average salary for those working at for-profit companies was $54,900, and the average salary in government was $48,900. Only the nonprofit sector was comparable, averaging $43,000 for employed humanities Ph.D.'s.
While overall salaries for female history Ph.D.'s still lag significantly behind those of their male counterparts, the survey indicates that salaries for recent female Ph.D. recipients (those who received their degree with the past 15 years) have an advantage over the salaries of their male colleagues. As a group, male history Ph.D.'s average $5,000 a year more than their female counterparts. But women less than five years away from the Ph.D. had an average salary of $36,400, compared to salaries for their male counterparts of $32,300. This advantage falls to a mere $700 difference for those six to fifteen years from the Ph.D., and becomes a decided advantage for male Ph.D.'s more than sixteen years from the degree.
History Ph.D.'s also enjoyed some of the highest levels of government support among the humanities disciplines. Almost 6 percent of history Ph.D. recipients reported some form of government assistance with their work. This was second only to the 8 percent of art history Ph.D.'s who received such aid. Although there is no specific data for history, the information for the broad category of the humanities indicates that these funds are more likely to go outside the academy, to nonprofit organizations, state and local governments, or private businesses.
Demographics of the History Ph.D. Cohort
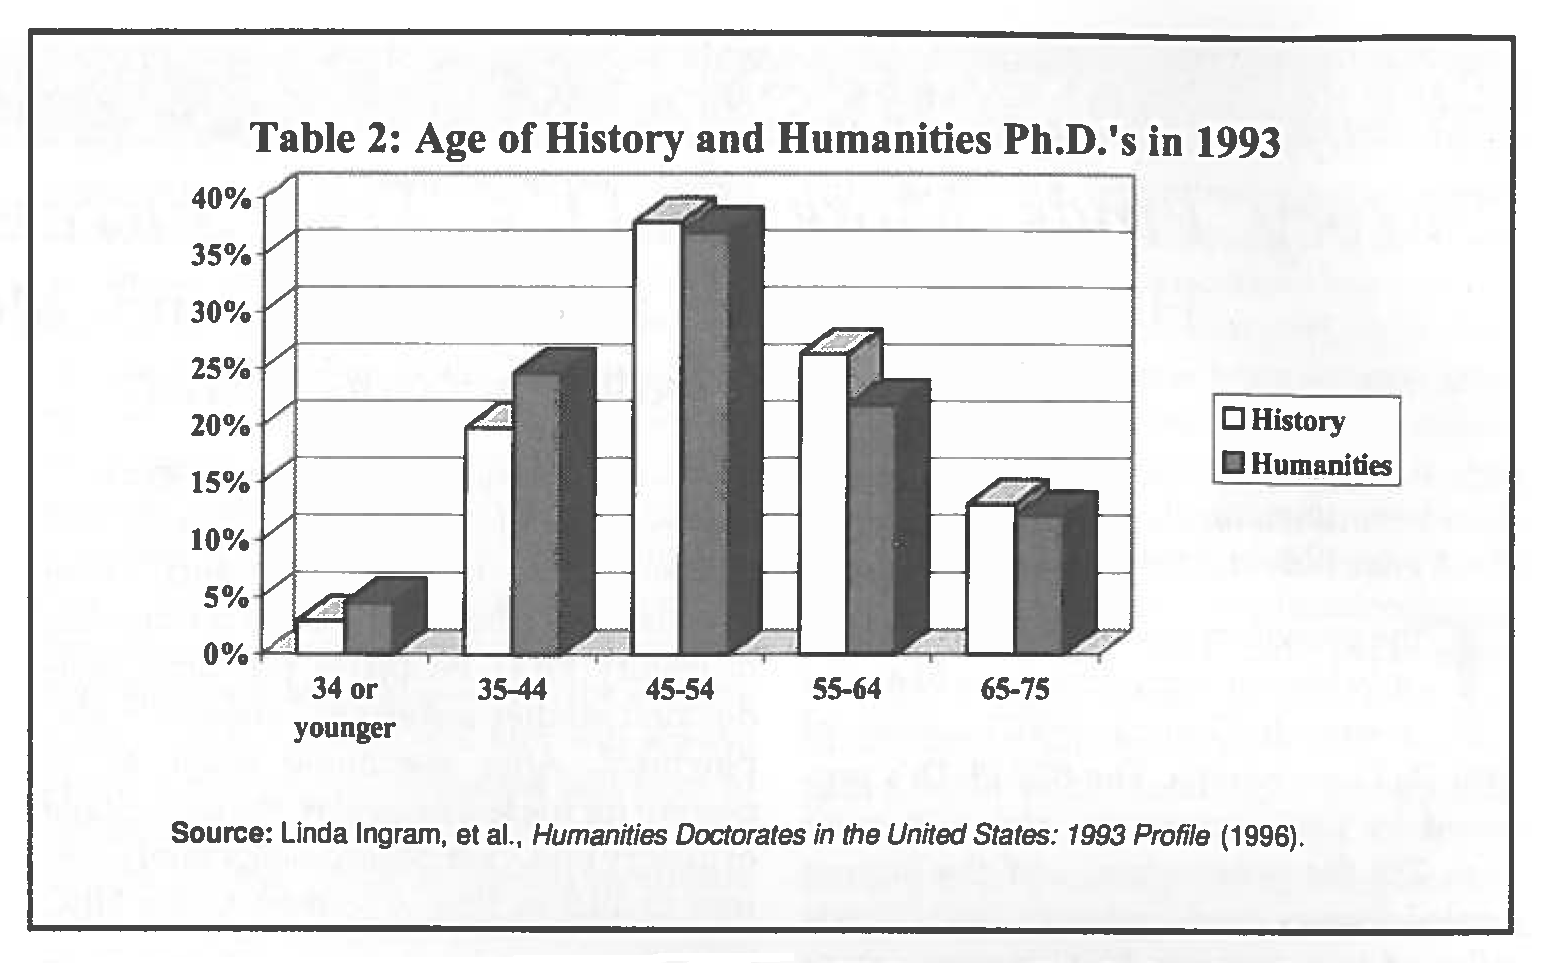
Demographically, the survey reports that the cohort of history Ph.D.'s is now older than it has been for quite some time, with 39.4 percent over the age of 55 and only 22.7 percent under the age of 44. (See Table 2). As a whole, 33.9 percent of humanities Ph.D.'s were over the age of 55, and 29.1 percent were under age 44. Sixty percent of the current history cohort received their degrees between 1960 and 1979, which represents the largest bulge in Ph.D. production in the humanities.
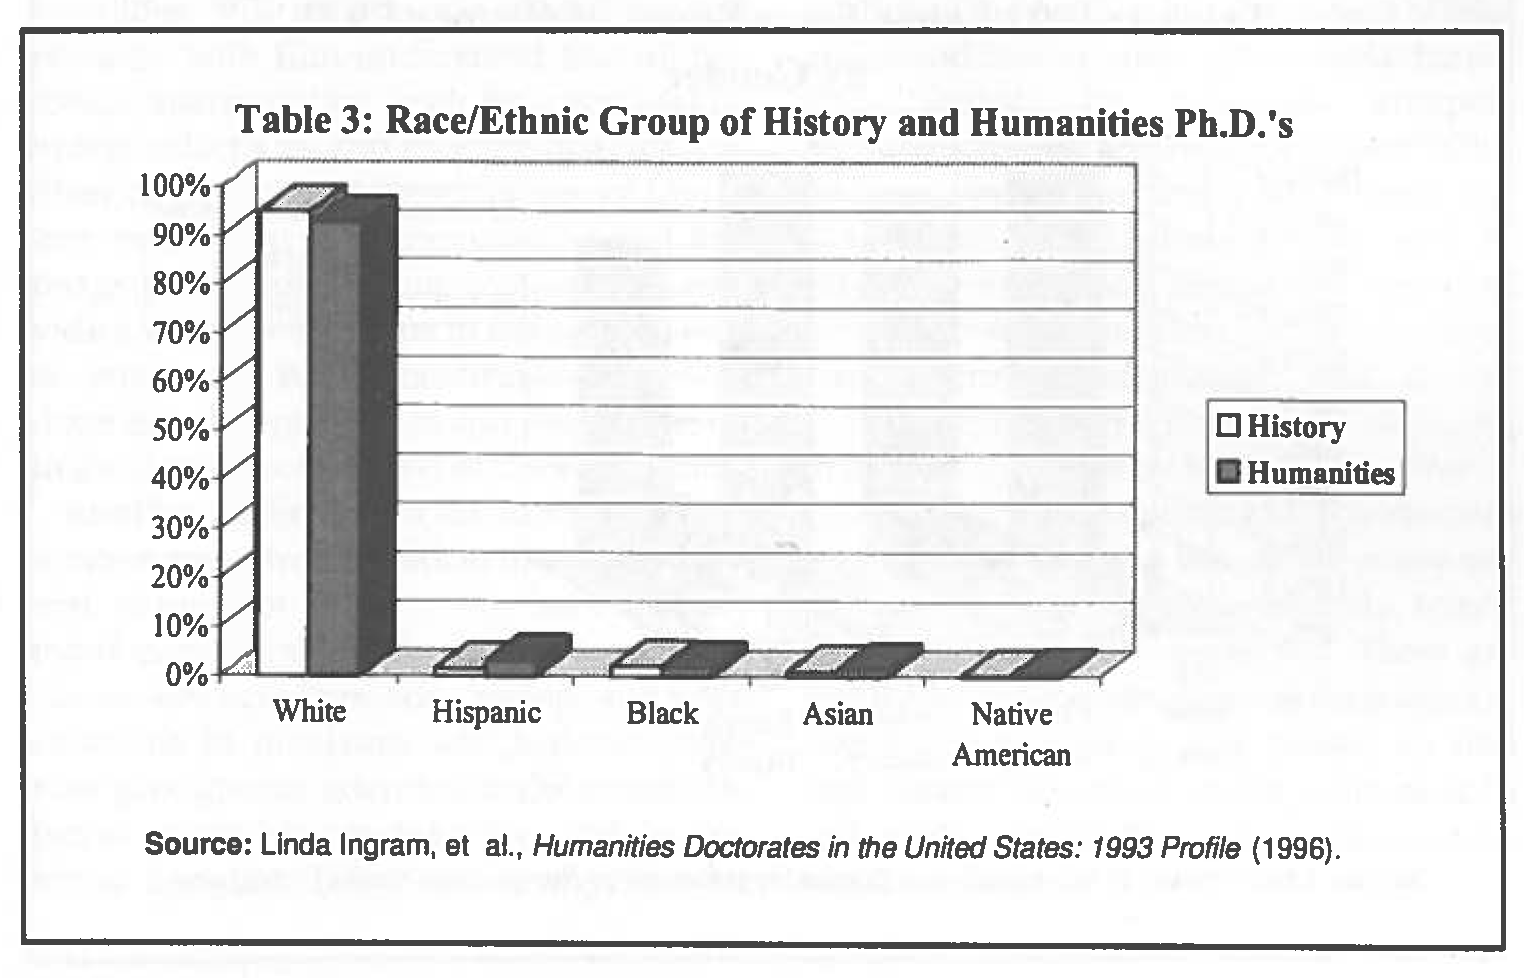
Women and minorities are underrepresented in the population of history Ph.D.'s, whether compared to the U.S. population as a whole or to the other humanities disciplines. Only 20.8 percent of the cohort were women, which places the profession behind all the other humanities except philosophy, where only 17 percent of the Ph.D.'s are women. As Table 3 indicates, the underrepresentation of minorities is even more stark-only 5 percent of the cohort was classified as a minority. This level of representation is below all but two other humanities fields, art history (with 3.8 percent) and classics (with 2.1 percent)
Most working history Ph.D.'s (77.3 percent) are employed in educational institutions, with 65.3 percent working in four-year colleges and universities. Of the rest, 6.6 percent are working in government at some level, 6 percent are employed in the nonprofit sector, 5.2 percent have jobs in the for profit sector, and 4.7 percent are self-employed. When broken down by occupation, history Ph.D.'s are working primarily professors or teachers (58.3 percent), while the rest work as managers or administrators (12 percent), historians (9.4 percent), or writers and media consultants (3 percent).
The NRC made significant revisions to the questionnaire between the 1991 and 1993 surveys to improve the quality of the data. Unfortunately this makes it impossible to provide time-series data.
Notes
1. R. O. Simmons and D. H. Thurgood, Summary Report 1994: Doctoral Recipients from United States Universities (1996).
2. Linda Ingram, et al., Humanities Doctorates in the United States: 1993 Profile (1995).
3. See "AHA Data Shows Increased Use of Part-time Faculty;" Perspectives, May/June 1995. The latest data (unpublished) from a survey with the 1995-96 Directory of History Departments tracked another 5 percent increase in the use of part-time faculty from the year before.
Tags:

This work is licensed under a Creative Commons Attribution-NonCommercial-NoDerivatives 4.0 International License. Attribution must provide author name, article title, Perspectives on History, date of publication, and a link to this page. This license applies only to the article, not to text or images used here by permission.
The American Historical Association welcomes comments in the discussion area below, at AHA Communities, and in letters to the editor. Please read our commenting and letters policy before submitting.
Comment
Please read our commenting and letters policy before submitting.


