News
Rising Tide of History Undergraduates Contrasts with Declining PhDs
But Demographics of History Students Quite Different from Other Fields
For the first time in six years, the Department of Education (DoE) reported both a real increase in the number of undergraduate history degrees awarded as well as a relative improvement in comparison to other fields—critical measures in drawing institutional resources to history departments. At the same time, the number of new history PhDs conferred declined for the third year, providing some hope to those looking for signs that the tight academic job market could loosen up a bit.
Marked Improvement at Baccalaureate Level
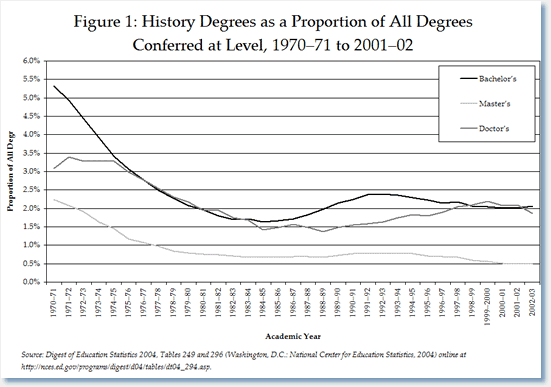
The number of new history baccalaureate degrees rose from 26,001 to 27,730 between 2001–02 and 2002–03. While history bachelor's degrees grew by 6.6 percent, the number of baccalaureate degrees conferred in all fields lagged, with just 4.4 percent growth. As a result, the discipline's "market share" grew from 2.01 percent to 2.06 percent of all degrees conferred (Figure 1).

Some of the ancillary data in the report suggests, however, that the field's growth is demographically limited because history does an unusually poor job in attracting a diverse array of students. As we detail below, whether one looks at the gender, race, ethnicity, or citizenship of recent degree recipients, at every degree level, the new history degree holders are significantly more homogeneous than those in other fields.
The number of undergraduates at American colleges and universities has been growing sharply in recent years, so the relative position of history in comparison to other fields is particularly important. Quite a few department chairs have complained recently that a growing number of students in their classrooms were not matched by added faculty to teach them. One can reasonably hope that as history gains relative to the other departments that the resources (and faculty lines) will follow.
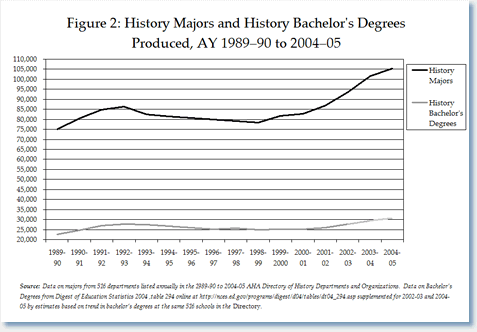
While we cannot be sure about continuing improvement relative to other disciplines, more recent data from the AHA's Directory of History Departments indicates that growth in the number of new undergraduate degrees in history will continue. The number of baccalaureate degrees reported to the Directory over the past two years—that is, since the latest numbers from DoE—shows a steady and continued growth in the number of history bachelor's degrees and history majors (Figure 2). At 516 departments listed regularly in the Directory, the number of new bachelor's degrees grew 11.5 percent from 2002–03 to the most recent 2004–05 academic year. Since these departments confer the vast majority of degrees in the field, this has been a very good indicator of trends in history degrees. And while it does suggest some leveling off in the growth of new history degrees, the DoE estimates that the trend among all fields is also slowing, and seemingly somewhat faster than in history. The DoE projects only a 3.1 percent increase in the number of new bachelor's degrees from 2002–03 to 2004–05.1

The continuing increase in the number of majors at history departments provides another sign that history will maintain its growth. The number of history majors at departments in the Directory rose 3.9 percent from 2003–04 to 2004–05. Growth in the number of history majors over the past five years has been particularly strong at public colleges and universities—growing by almost a third since the 2000–01 academic year—particularly in comparison to private, religiously affiliated schools, where growth was limited to just 18.4 percent. There are some marked regional differences as well. Schools in the Plains states and in the far West have reported that the number of new history majors only grew about 20 percent over the past five years, in comparison to the more than 33 percent growth in New England, the Southeast, and the Southwest.
Whither the History Graduate Degree?
The growing number of undergraduates studying history stands in marked contrast to the trends among graduate-level degrees in the field. The number of new master's degrees in history increased by 4.3 percent from the year before—from 2,420 in 2001–02 to 2,525 in 2002–03—a figure that seems modest when compared to the number of master's degrees in all fields, which grew 6.3 percent over the same span.
History master's degrees have been waning for decades, and have now diminished to less than one-half of one percent of all master's degrees conferred. Even with the modest increase reported this year, the number of master's degrees conferred in history remains near its lowest point in the past 15 years.
As the recent report from the AHA's Committee on the Master's Degree in History (CMD) noted, there is real confusion about the function and purpose of the master's degree in history.2 Viewed broadly, the master's degree seems to be shifting to fields where the degree can have a more immediate vocational effect. In the most recent report, fields such as education, computer science, and psychology conferred more than a third of all master's degrees.
While the CMD observed a significant amount of ambivalence among students and departments about the utility of a history MA, they did note that the degree remains a critical element in the training of history PhDs. Looking at the ratio of history MAs to history PhDs validates that perception. In the 1970–71 academic year, universities conferred more than five history MAs for every new history PhD. In the past few years that has fallen to fewer than three MAs per PhD. Given that a significant proportion of PhD programs confer MAs as a matter of course on doctoral students who reach a certain mark in their studies (even if they don't go on to finish the PhD) this suggests a clear diminution in the number of students taking MAs for other purposes.
At the same time, the number of new PhDs in history fell in both real and relative terms, declining from 924 to 861 in 2002–03—nearly a 7 percent decrease—even as the number of doctorates conferred in all fields rose 4.3 percent. As a result, history PhDs comprised less than 2 percent of the new doctorates for the first time in six years. While history comprised 1.87 percent of the doctorates in 2002–03, the field had conferred 2.20 percent of the degrees just three years earlier.3 Given the recent surge in undergraduate degrees, it is hardly surprising then that for the first time in five years, the market share of history PhDs fell below the market share for history bachelor's degrees.
This is the smallest number of new history PhDs conferred since the 1996–97 academic year (when 805 history PhDs were awarded), but still well above the number of PhDs awarded 20 years earlier, when only 575 history PhDs were conferred. As we noted in our last job market report, a sharp drop in the number of new history PhDs in the 2002–03 academic year was followed by a sizeable increase in the number of PhDs reported the following year. Nevertheless, the number of graduate students in history doctoral programs and the number of students reportedly working on dissertations has fallen steadily over the past five years.

Homogeneity and History
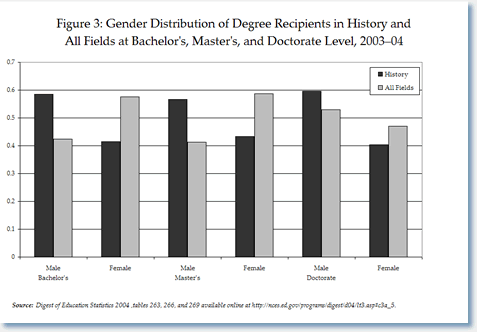
The DoE data also provides detailed demographic information about the new history degree recipients, and provides fresh evidence that the discipline has an unusually limited appeal to women and minorities. Among undergraduates earning history degrees in 2002–03, 58.5 percent were men (Figure 3) and 84.2 percent of the U.S. citizens receiving degrees were white, non-Hispanic.
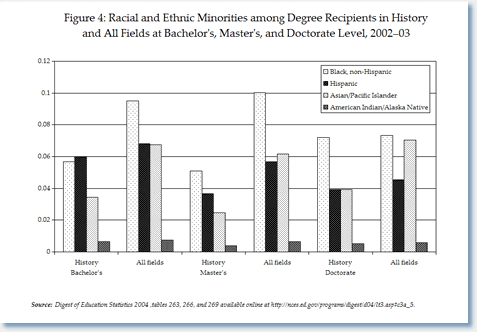
Among the new history degree recipients, 6.0 percent were Hispanic, 5.7 percent were black non-Hispanic, 3.4 percent were Asian/Pacific Islanders, and 0.6 percent were Native Americans (Figure 4).

This is markedly different from degree recipients in all fields, where 42.5 percent of the new bachelor's degree recipients were men and 76.2 percent of the U.S. citizens were white, non-Hispanic. The difference is even more marked when compared to the other humanities and social science disciplines. The fields of "philosophy and religious studies" were the only other disciplines in which more than half of the degree recipients were male. And while more than 80 percent of the new degree recipients in English and philosophy and religious studies were white, non-Hispanic, history had the highest proportion among all humanities and social science fields. In fact, only five fields conferring more than 125 degrees reported a higher proportion of white, non-Hispanic degree recipients—education, theology, mechanics, construction, and agriculture.
Perhaps the most unusual finding in the DoE figures is that just 0.7 percent of the history bachelor's degrees were awarded to nonresident aliens. Only two fields—"military technologies" and "security and protective services"—conferred a smaller proportion of degrees on non-citizen students. The average among all fields was 3.2 percent. Given the limited national security implications of our discipline, one can only assume that it is the local and national optics of the discipline that make the subject so unappealing to foreign students.
The demographics of the new graduate degree recipients were quite similar to those of their undergraduate counterparts. Among new history MA recipients, 56.8 percent were men and 88.6 percent of the U.S. citizens receiving master's degrees were white, non-Hispanic, while 5.1 percent were black non-Hispanic, 3.7 percent were Hispanic, 2.5 percent were Asian/Pacific Islanders, and 0.4 percent were Native Americans. Among all fields, just 41.2 percent of the new master's degree recipients were men, and only the field of agriculture and natural resources reported a larger proportion of white, non-Hispanic degree recipients (the average among all fields was 77.5 percent).
Similarly, among history doctorate recipients, 59.7 percent were men and 84.5 percent of the U.S. citizens were white, non-Hispanic. At this level, the field is comparatively similar to the demographics of all fields conferring doctorates, where 52.9 percent of the degree recipients were male and 80.5 percent were white, non-Hispanic.
There is also a notable difference between the racial and ethnic demographics of bachelor's and doctorate degree recipients. While a larger proportion of undergraduate degrees in history go to Hispanic students, a larger proportion of PhDs are earned by black, non-Hispanic students. Among U.S. citizens earning history PhDs, 7.2 percent were black, non-Hispanic and 3.9 percent were Hispanic (as compared to 5.7 percent and 6.0 percent, respectively, among students receiving undergraduate degrees in the field). Of the remaining history doctorates, 3.9 percent were earned by Asian/Pacific Islanders, and 0.5 percent were earned by Native Americans.
At both the master's and doctoral level, a significantly larger proportion of the degree recipients were nonresident aliens, but the discipline was still significantly different than other fields. At the master's level, 5.2 percent of the degree recipients were non-citizens, but the average among all fields was 14 percent. At the doctoral level, only 8 percent of the degree recipients were not citizens—well below the average of 25.3 percent. At that level, only the field of psychology attracted fewer foreign students.
The data does not tell us whether there is something in the form or structure of history departments and the discipline that attracts an unusually homogenous student population or, conversely, drives women, minorities, and foreign students away. Plainly though, if the field could draw a more demographically diverse student population, history departments would increase the number of students in the classroom and be in a much stronger institutional position at colleges and universities.
—Robert B. Townsend is AHA assistant director for research and publications.
Notes
1. Thomas D. Snyder and Alexandra G. Tan, Digest of Education Statistics, 2004 (Washington, D.C.: Department of Education, 2005), available online at http://nces.ed.gov/programs/digest/d04/. This report draws particularly from tables 250–51, 263, 266, 269, and 294.
2. Philip M. Katz, Retrieving the Master's Degree From the Dustbin of History (Washington, D.C.: American Historical Association, 2005).
3. This number differs from the number of PhDs reported as conferred in our tabulations from the Directory of History Departments that year (810 PhDs) and other data collected by the National Opinion Research Center (NORC)—which reported 940 history PhDs— because each data source collects the information in a slightly different way. The NORC data, for example, allows the degree recipients to choose the field of their degree—regardless of the department conferring it—while the DoE asks the university to assign the discipline. Since each data source allows us to ask different comparative questions, we report each on its own terms. Despite these differences in the data, it is clear that the number of PhDs conferred fell between the 2001–02 to 2002–03 academic years.
Tags: Graduate Education
Comment
Please read our commenting and letters policy before submitting.


