News
History Degrees Declining Relative to Other Fields, but Newer Data Provides Some Cheer
Information from the latest Department of Education (DoE) report (pertaining to the years 1997–98 to 2001–02) suggests that in the competition for students, history lost ground while the total number of undergraduate students at colleges and universities grew quite quickly.1 However, more recent—if limited—data gathered for the AHA's annual Directory of History Departments, Historical Organizations, and Historians indicates that the picture is not all that gloomy, and that there is, in fact, an upswing in the number of students opting for history.
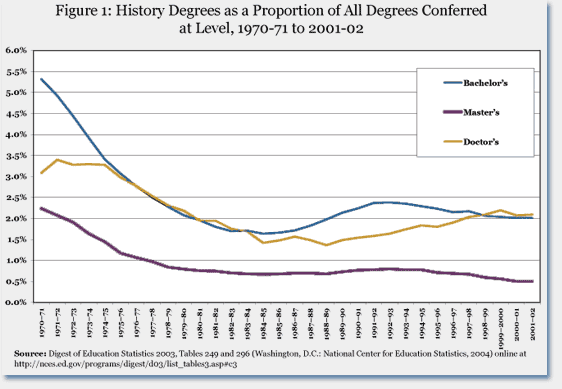
According to the DoE report, between 1997–98 and 2001–02, the number of history bachelor's degrees grew by 3.2 percent while the number of baccalaureate degrees conferred in all fields grew by more than 10 percent. As a result, history has declined from 2.15 percent of all degrees conferred to 2.01 percent (Figure 1). While this is a significant improvement from the field's nadir in the mid-1980s, when it fell to almost 1.5 percent of all degrees conferred, it is less than half of the field's share of degrees 30 years earlier.
In the most recent years of the DoE report, the gap between the growth in history degrees and the rest of the academy narrowed slightly. History bachelor's degrees grew 3.6 percent over the prior year (from 2000–01 to 2001–02) while all fields grew 3.8 percent. In real terms, the number of history bachelor's degrees rose from 25,090 to 26,001 degrees conferred (Figure 2).
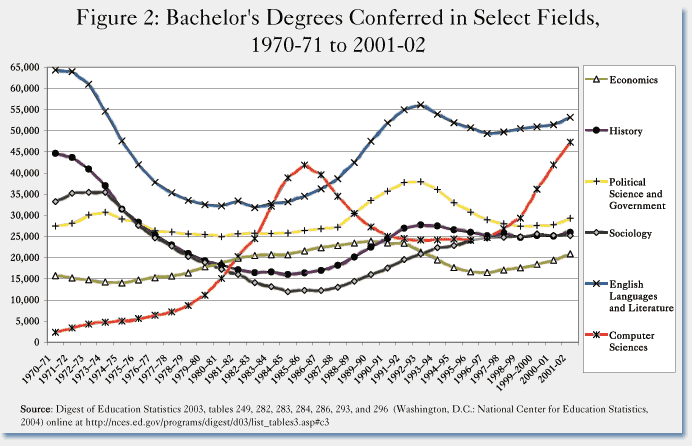
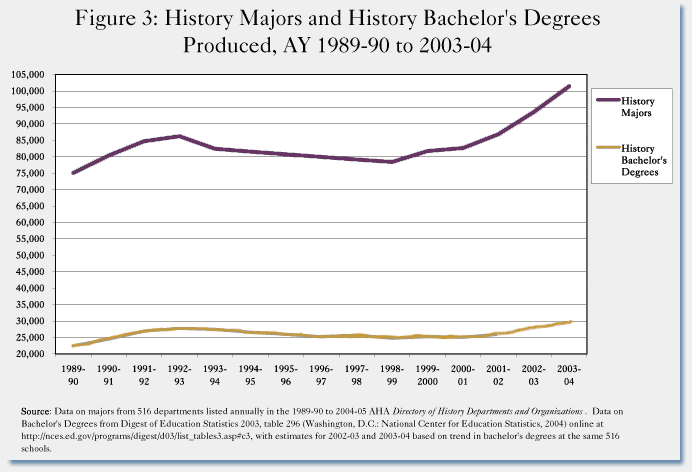
This slight upswing in the history numbers, noted by the year 2001–02 in the DoE data, appears to be confirmed by more recent data. Over the past two years history departments across the country have been reporting (for the AHA's Directory) that the number of new history majors in their departments was growing so fast that there weren't enough teachers available.2 Indeed, if we take the number of history majors and degrees reported in the last two editions of the Directory of History Departments (that is, for the years 2002–03 and 2003–04) and plot that data into the graphs generated from the DoE data, it is evident that the trend lines will have a more cheerful look—showing not only continuing growth in the number of history degrees but also hinting at more dramatic growth in later years.
At the 516 departments that have listed regularly in the Directory since 1989, the number of majors grew almost 17 percent between the 2001–02 academic year and 2003–04. Over the same span, the number of bachelor's degrees reported has grown at a slightly less torrid pace, rising almost 14 percent (Figure 3). The rapid growth we have seen in the field of history over the past two years contrasts with projections of the Department of Education, which suggest that growth in the total number of undergraduates is leveling off.3 If these estimates bear out there is good reason to expect that history will gain ground on the rest of the academy in the next few reports from the DoE.
Trends in History Graduate Degrees
The trend in the number of upper-level degrees as shown by the DoE figures was slightly different. The number of master's degrees grew a more modest 2.3 percent in the most recent year—to 2,420 in 2001–02 from the 2,365 reported in 2000–01 (Figure 4).
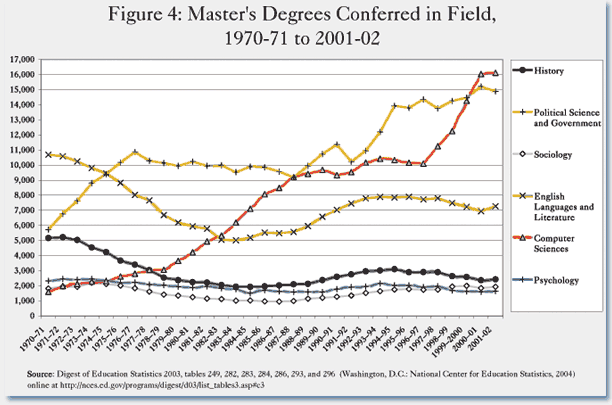
Despite the recent increase, the number of master's degrees conferred is near the lowest point in the past 10 years. Viewed against all fields, history master's degrees remain at their lowest level on record, at a slender 0.5 percent of all degrees conferred. History lost ground fairly steadily, as more practically oriented fields like computer science and psychology all gained substantially. The field of education, however, still confers the largest number of degrees—more than a quarter of all master's degrees conferred.
The information on the number of history PhDs is somewhat anomalous. The DoE figures showed a tiny decline in the number of PhDs, from 931 to 924 degrees (Figure 5). This contrasts with small increases we reported earlier, based on the counts of new PhDs listed in the Directory of History Departments, and the separate survey conducted for the federal government by the National Opinion Research Center (NORC).4
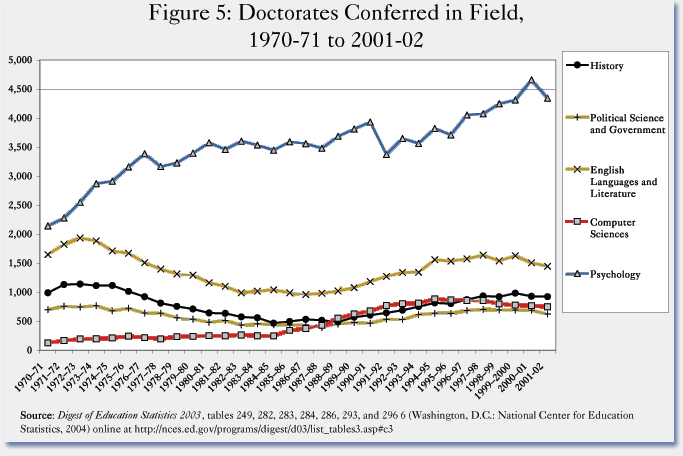
The differences between the surveys can be attributed to variations in the way the data is collected. The NORC data, for instance, uses categories selected by the degree recipient, while the DoE lets the institution assign the discipline category. Regardless of the modest differences between the surveys, they all agree that the number of history PhDs conferred during the academic year 2001–02 is very near a 25-year high.
And notably, for the third year, history PhDs comprised a larger proportion of the total degrees conferred at that level (2.09 percent) than history bachelor's degrees do at that level (2.01 percent).
Gender Demographics of Degree Recipients
As a field, history continues to attract a disproportionate number of men, from the baccalaureate to the doctoral level. The DoE data reports that 58.7 percent of the history bachelor's degrees conferred in 2001–02 went to men, in contrast to 42.6 percent of all degrees conferred at that level. The proportion of women receiving history degrees shrank slightly from the year before—from 41.5 percent to 41.3 percent of the degrees conferred—even as their numbers rose in absolute terms.
In other humanities and social science fields—including English languages and literature; area, ethnic, and cultural studies; sociology; and anthropology—the representation of women is well over 60 percent among new degree recipients.
The difference is slightly smaller at the master's degree level, where women comprised 44.8 percent of the degrees conferred, as compared to an average 58.7 percent among all fields. Unlike the trend at the baccalaureate level, this marked a small improvement in the representation of women—an increase from 44 percent the year before. Still, only a few of the other social science fields, like geography (39.8 percent), economics (39.5 percent), and political science (44 percent) had a smaller proportion of females.
The proportion of women receiving doctorates in history was even smaller, though the history field is relatively close to the average (reflecting the comparatively small number of women receiving PhDs). Women comprised 39.3 percent of the new history doctoral recipients, as compared to an average of 46.3 percent among all fields.
—Robert B. Townsend is AHA assistant director for research and publications.
Notes
1. T. D. Snyder, A. G. Tan, and C. M. Hoffman, Digest of Education Statistics 2003 (Washington, D.C.: National Center for Education Statistics, 2004). Online at http://nces.ed.gov/pubsearch/pubsinfo.asp?pubid=2005025.
2. See Robert B. Townsend, “Latest Figures Show Sizeable Increases in History Majors and Bachelor's Degrees,” Perspectives (April 2004), 17.
3. Digest of Education Statistics, Table 176
4. Data on the number of PhDs listed in the Directory was included in Robert B. Townsend, “Job Market Report 2002: History Posts Gains Despite Economy,” Perspectives (December 2002); Data from the NORC survey was published in Robert B. Townsend, “Number of History PhDs Inches Upwards,” Perspectives (January 2004), 13.
Tags: Graduate Education The History Major
Comment
Please read our commenting and letters policy before submitting.


